The chart and data that follow highlight non-commercial commodity futures trading positions as of August 28, 2018. This data was released with the August 31, 2018 COT Report (Commitment of Traders).
Note that this chart also appeared on my blog.
The chart below looks at non-commercial futures trading positions for Russell 2000 Index futures. For the week, the Russell 2000 (INDEXRUSSELL:RUT) finished up +0.9%, while the Russell 2000 ETF (NYSEARCA: IWM) closed up +0.8%.
Here’s a look at Russell 2000 futures speculative positioning. Scroll further down for commentary and analysis.
The Russell 2000 is in a strong uptrend, albeit steep. A pullback to breakout support may be nearing (see comments below).
Let’s look at the COT data and technical to see what’s next…
Russell 2000 Futures: Currently net long 5.8k, up 2.1k.
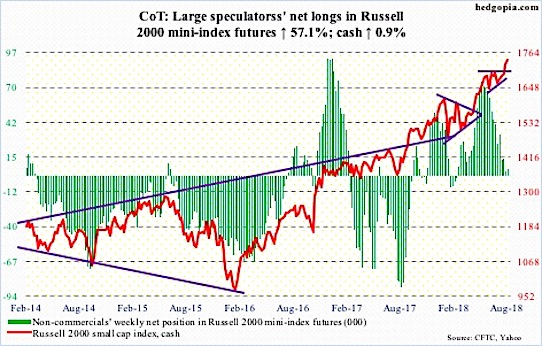
Money flows continue to be positive for the iShares Russell 2000 ETF (IWM) gaining $274 million during the week ending Wednesday (data courtesy of ETF.com). The recent breakout to new highs likely helped those figures. The breakout occurred last Tuesday with a lift over 1710. A measured-move now targets a price point somewhere in the 1780s. But it may not be a straight line.
The Russell 2000 Index rallied as high as 1742 intraday on Friday. It’s now showing some signs of fatigue. Look for a retest of breakout support over the short term – initial support lies at 1722.
Twitter: @hedgopia
Author may hold a position in mentioned securities at the time of publication. Any opinions expressed herein are solely those of the author, and do not in any way represent the views or opinions of any other person or entity.

 Testing Important Price Support")
: Cup (and Maybe Handle) Watch")


