(Gold continued)
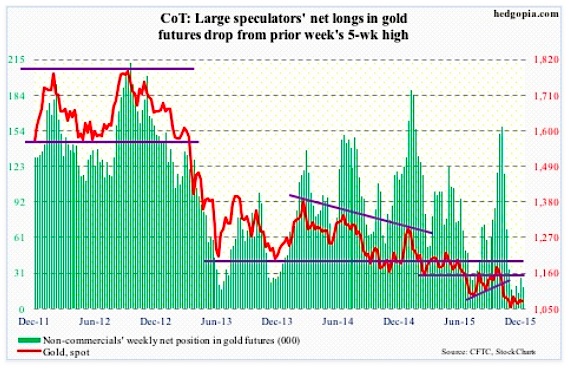
Early last week, it looked like a 10/20 crossover (daily average) was in the making… which is still the case, and should help the metal should it complete.
In the past month and a half, gold bugs have tried several times to take out the 1,080 resistance – unsuccessfully – including yesterday.
After having substantially cut back net longs, non-commercials are yet to show the kind of love they did even two months ago. Holdings of Gold futures continue to hover near multi-year lows.
January 4 COT report data: Currently net long 19.1k, down 7.3k.
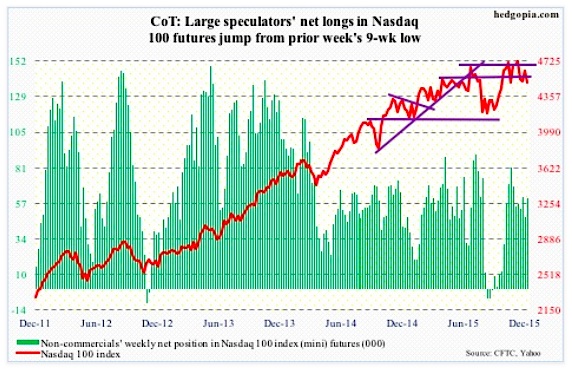
Nasdaq 100 index (mini): Tech-heavy stock indices fared well last year, with the Nasdaq 100 up 8.4 percent and the Nasdaq composite up 5.7 percent. In contrast, the S&P 500 fell 0.7 percent and the Dow Industrials lost 2.2 percent.
The tech outperformance is laudable until we consider this. The so-called FANG propelled these indices. Facebook (FB) rallied 34.2 percent, Amazon (AMZN) 117.8 percent, Netflix (NFLX) 134.4 percent, and Alphabet (GOOGL, formerly Google) 46.6 percent.
In the Nasdaq 100, these four names are respectively weighted 4.3 percent, 5.5 percent, 0.9 percent, and 4.6 percent. At 12.9 percent, the largest weight goes to Apple (AAPL), which lost three percent last year. Technically, it has broken its June 2013 trend line. And, there is potentially a head-and-shoulders pattern forming on a weekly chart, with the neckline break occurring around $105, where it sat on Thursday and was broken intra-day yesterday, but was salvaged by close. AAPL remains grossly oversold on a daily basis, let us see if bulls can take advantage of this as well as yesterday’s reversal.
Further, it is hard to imagine the FANG names – particularly AMZN and NFLX – repeat their performance this year. Can energy – last year’s laggards – provide the leadership? The SPDR Energy ETF (XLE), lost 21.5 percent in 2015. Even if it does, it does not help the Nasdaq 100 much.
For some time now, 4560 has proven to be an important price point, and was lost yesterday; the index did, however, manage to save the 200-day moving average.
January 4 COT report data: Currently net long 60.9k, up 13k.
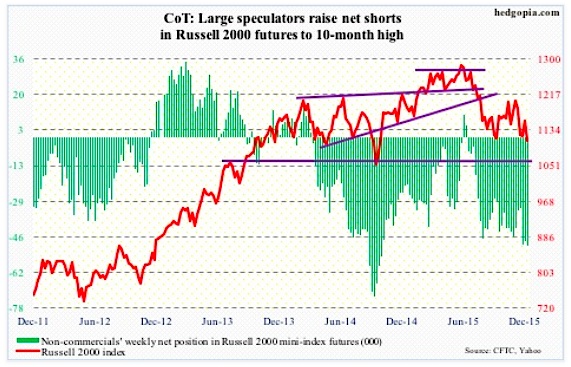
Russell 2000 mini-index: If we are indeed in a sustained tightening cycle in the U.S., then small-caps stocks will probably continue to lag large-caps. In 2015, the Russell 2000 index lost 5.7 percent, lagging large-caps big time.
If small-caps were any indication, investors were not in risk-on mode last year. This is the same as high-yielding stocks lagging dividend growth stocks, or, for that matter, debt-heavy stocks over cash-rich.
How about 2016?
Well, the year has not gotten off to a good start, and 2015 did not end well.
Early last month, the 1210-1215 resistance, which has been in place since March 2014, held firm, with the index subsequently also losing 1170.
The 200-day moving average is decidedly pointing lower, with the 50-day flat to slightly down.
The index is now down 14-plus percent from the July 2015 high.
Kudos to non-commercials for having nailed this. Per COT report data, net shorts are at a 10-month high.
January 4 COT report data: Currently net short 49.6k, up 2.4k.
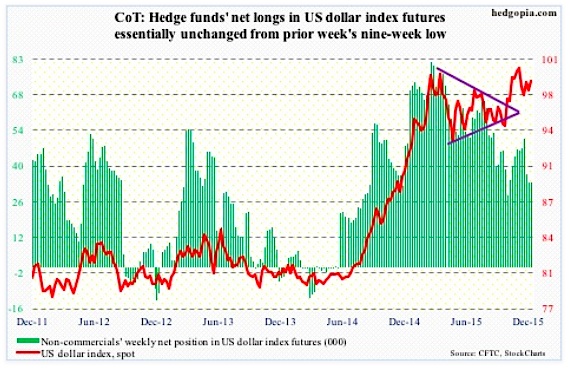
US Dollar Index: The Dollar gained nine percent in 2015, its third straight year of gains.
At least going by non-commercials’ holdings, it is tough to argue the streak continuing in 2016.
Back in March last year, the US Dollar Index reached a high of 100.71, before coming under pressure. Then in November, it tested that high by rallying to 100.60. Per COT report data, non-commercials were net long a lot more contracts in March than they were in November. That is not a vote of confidence from these traders in the US Dollar Index going forward.
In the prior week, they cut back net longs to a nine-week low.
January 4 COT report data: Currently net long 33.6k, up 208.
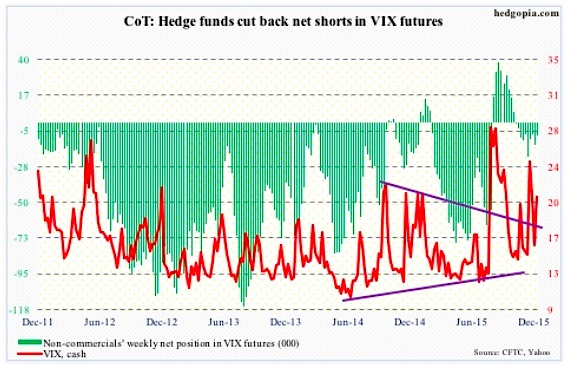
VIX Volatility Index: In the prior week, the spot VIX Volatility Index was acting like it wanted to rally. That it has… and it continued to do so yesterday.
As recently as the middle of December, the VIX shot up to just under 27, before reversing. No such spike-reversal signal just yet. That said, the VIX was unable to hang on to the gains yesterday, as it got slammed in the last half hour. Worth watching for a volatility spike that gets sold.
January 4 COT report data: Currently net short 8.4k, down 5.4k.
Thanks for reading.
Twitter: @hedgopia
Read more from Paban on his blog.
The author does not have a position in any of the mentioned securities at the time of publication. Any opinions expressed herein are solely those of the author, and do not in any way represent the views or opinions of any other person or entity.


