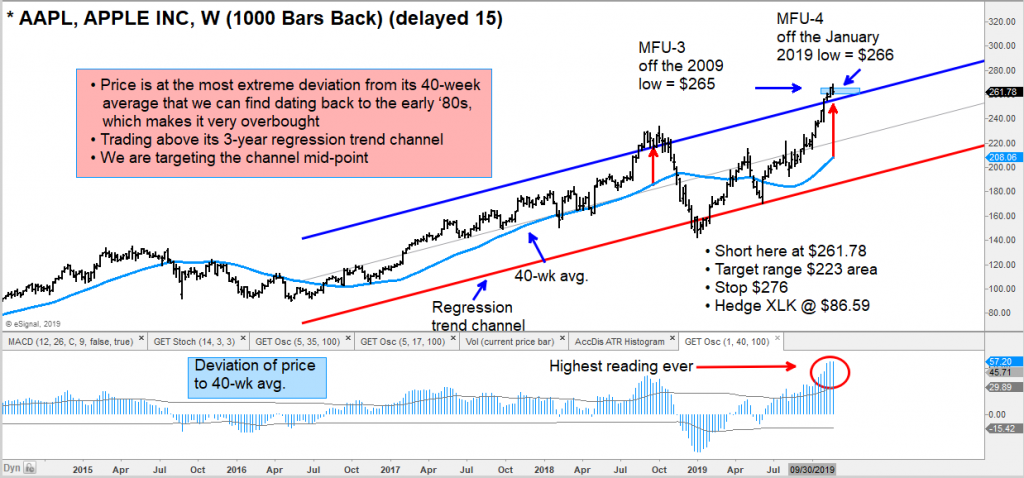
$AAPL Apple Stock Chart Analysis – Time for a Pullback?
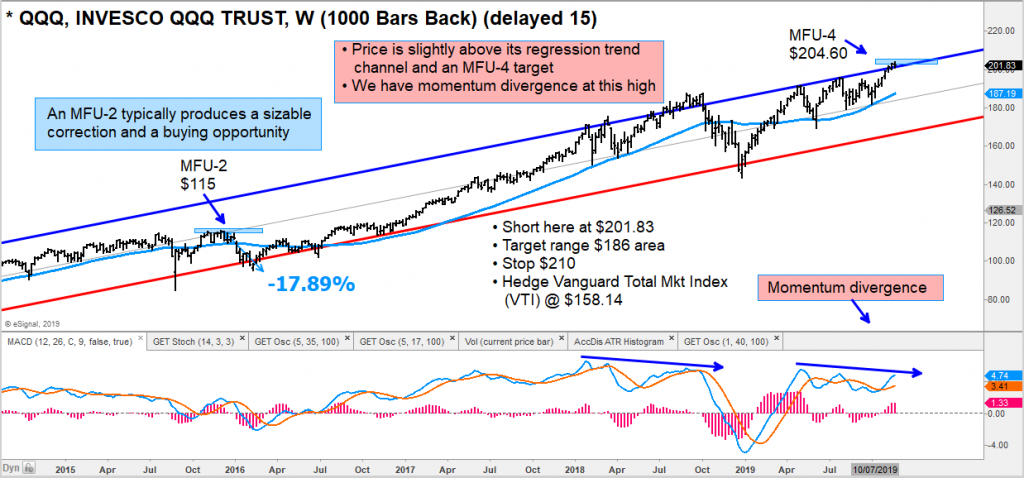
Both Apple stock (AAPL) and the Nasdaq 100 QQQ’s ETF have hit important Money Flow Unit (MFU) price targets at last weeks high.
See the Apple (AAPL) stock chart above and the QQQ chart further below.
I believe the odds favor taking profits or even establishing a tactical short position (for those that are savvy and disciplined).
At the core of our approach are Money Flow Units (MFU), something known to only three people in the industry.
The MFU measures the capital flow in and out of an asset.
Think of these as baskets of capital that are flowing into a stock or index when bottoming. At some point, the amount of capital flow will overwhelm supply and propel the next leg up, forming MFU targets. Conversely, at highs, an MFU will form and overwhelm demand, which will start the downside process.
This model has been successfully used to manage long-only portfolios as well as hedge funds, and to guide portfolio managers on what global regions to invest in, sectors and down to individual stock ideas.
Depending on the market cycle we are in, significant corrections are formed from an MFU-3 (70%) or MFU-4 (25% of the time). At significant market extremes such as the 2002 high or 2009 low, an MFU-5 will occur 5% of the time.
Here’s the chart of the QQQs:
The author may hold positions in mentioned securities at the time of publication. Any opinions expressed herein are solely those of the author, and do not in any way represent the views or opinions of any other person or entity.

: Showing Some Signs of Emerging Strength")
