Since Donald Trump was elected President, the S&P 500 (INDEXSP:.INX,) has rallied over 21% or nearly 500 points.
In our opinion, a good portion of the gain is attributable to his promise, as well as congressional efforts, to reform the tax code. In particular, the proposed sharp reduction in the corporate tax rate has the equity market’s attention.
At first blush, the simple logic driving equity investors appears reasonable. Appearances, however, can be deceiving, and history is littered with failed investors that banked on a faulty thesis. As such, instead of tripping head first into that same category, we decided to assume nothing and look at the proposed reduction in the corporate tax rate and historical data to better understand how the legislation might affect the economy and corporate earnings.
Corporate Tax Rates
The graph below highlights the statutory and effective corporate tax rates since 1947.
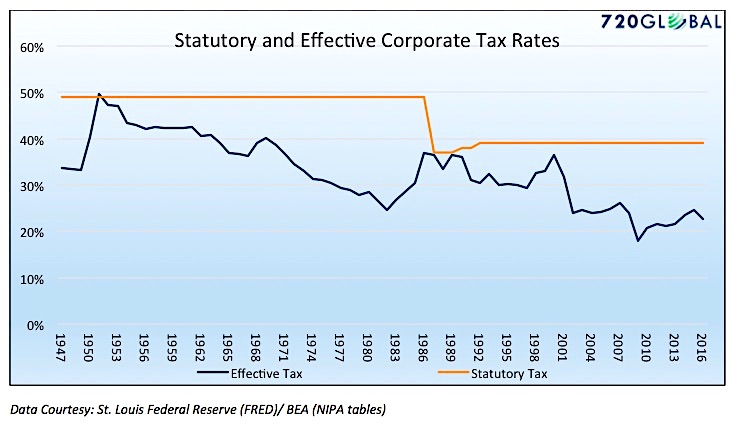
The statutory tax rate is the legally mandated rate at which corporate profits are taxed. As shown above, the rate has been consistent over the last 75 years except for one significant change as a result of the Tax Reform Act of 1986.
The effective corporate tax rate is the actual tax rate companies’ pay. One can think of the statutory rate as similar to the MSRP sticker price on a new car. It provides guidance on cost but consumers always pay something less. The effective tax rate, like the “discounted” price one pays for a car, is the actual percentage of profits that corporations remitted to the government. This rate is calculated by dividing a company’s tax payments by their pre-tax profit. Deductions of all sorts reduce the pre-tax profit, thus creating a difference between the statutory and effective tax base and therefore the amount paid. For purposes of this article, we aggregate corporate tax receipts and corporate profits to calculate an effective rate for all corporations.
From 1947 to 1986 the statutory corporate tax rate was 49% and the effective tax rate averaged 36.4% for a difference of 12.6%. From 1987 to present, after the statutory tax rate was reduced to 39%, the effective rate has averaged 28.1%, 10.9% lower than the statutory rate.
Based on this simple analysis thus far, it is easy to understand why equity investors are giddy over a sizeable reduction in the corporate tax rate. If the statutory rate is reduced to 20% as proposed, and the effective rate remains 10% lower, the amount of money corporations pay in taxes will be reduced sharply. Based solely on this assumption, corporate after-tax profits, in year one alone, should increase by almost $200 billion while federal corporate tax receipts will be reduced by the same amount. Such a boost in corporate earnings would increase the forecasted internal rate of return (IRR) on the S&P 500 by approximately .90%. Holding everything else constant this equates to a price increase of 285 points for the S&P 500 or an 11% gain from today’s level. It is impossible to assess how much of the gain since the election is due to tax reform expectations and how much is due to other factors, but we wager a good portion of it has been based on the promise of tax reform.
History
While the math and logic above seem sound, we can turn to historical data to understand the relationship between taxes and economic growth and profits. In doing this, we can better forecast the actual effects that lower corporate taxes might have on economic growth and corporate profits.
The graph below compares the effective corporate tax rate to the running three-year average GDP growth rate. The dotted trend lines smooth the data to allow for a clearer comparison.
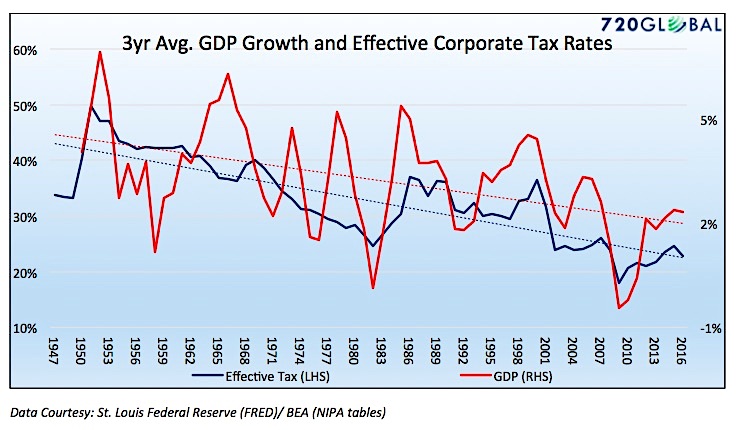
As is clearly observable, GDP has trended lower at a very similar pace as the effective corporate tax rate. The graph below puts the data in a scatter plot format to evaluate the statistical relationship between corporate tax rates and economic growth rates.
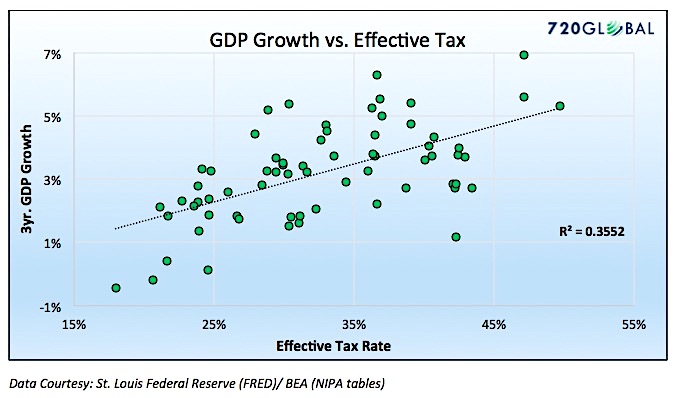
The R² shown above (.3552), a statistical measure of correlation, is far from perfect, but there is a reason to believe that lower effective tax rates may partially explain the weakening trend in GDP growth. Based on statistical regression, every 1% decrease in the effective tax rate should diminish GDP growth by 0.12%.
The President, his economic team, and lawmakers are selling the tax bill with claims that a reduction in corporate taxes will boost economic growth. Based on data from the last 75 years, that has never been the case. In fact, the average annualized GDP growth rate in the five years before the major statutory tax reduction in 1986 was 3.90%. In the five years following the tax cut, the average annualized growth was reduced by more than half to 1.93%.
Next, we show a scatter plot comparing effective tax rates to corporate profits.
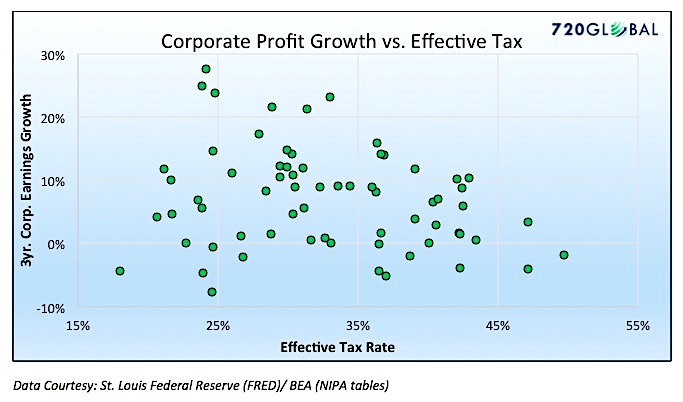
As measured by a R² of .051, the graph above shows that over the last 75 years, there has been no measurable relationship between effective corporate tax rates and corporate profit growth.
Who Pays
The historical evidence above tells a different story than the bill of goods being sold to citizens and investors. Corporate tax rates are positively correlated with economic growth which means that lower corporate tax rates equate to slower economic growth. Further, there is strong evidence that corporate profits are largely unaffected by tax rates.
Investors buying based on the benefits of the tax proposal appear shortsighted. They value the benefits of corporate tax cuts, but they are grossly negligent in recognizing how the tax cuts will be funded.
The tax bill, as it is currently proposed, will increase the deficit by $1.5 trillion over ten years. As such, the government will borrow an additional $1.5 trillion on top of current projections of approximately $1 trillion per year.
When the government borrows money to fund a fiscal deficit they effectively crowd out investment that could have funded the real economy. Said differently, the money required to fund the government’s deficit cannot be invested in the pursuit of innovation, improving workers skills, or other investments that pay economic dividends in the future. As we have discussed on numerous occasions, productivity growth drives economic growth over the longer term. Therefore, a lack productivity growth slows economic growth and ultimately weighs on corporate earnings.
A second consideration is that the long-term trend lower in the effective corporate tax has also been funded in part with personal tax receipts. In 1947, total personal taxes receipts were about twice that of corporate tax receipts. Currently, they are about four times larger. The current tax reform bill continues this trend as individuals in aggregate will pay more in taxes.
As personal taxes increase, consumers who account for approximately 70% of economic activity, have less money to spend.
Summary
As is often the case in economics and investing, there is a “seen” and an “unseen.” The “seen” is widely visible and, right or wrong, generally represents a consensus agreement about reality. The “unseen,” while equally important, largely goes underappreciated. In time, it is the “unseen” that will affect economic growth rates and corporate earnings. It is the “unseen” that investors must grasp if they are to be successful. In this case, the “unseen” is the massive federal deficit. Its burden on the economy prevents traditional forms of stimulus from having their desired effects.
Given the historical evidence regarding the implications of corporate tax cuts, we are left questioning the so-called “Trump bump.” We would argue that a market rally based on that premise is incoherent, and the market should be discounting prices and valuations due to the tax cuts not inflating them.
Twitter: @michaellebowitz
Any opinions expressed herein are solely those of the author, and do not in any way represent the views or opinions of any other person or entity.


: Showing Some Signs of Emerging Strength")
