Saying 2020 has been a news-filled year so far is probably an understatement.
We have had an escalation of conflict between the U.S. and Iran, the signing of a trade deal (Phase 1), an impeachment acquittal, and the rise of the coronavirus. Add it all together and we have markets near all time highs… long live the bull.
Instead of revisiting any of the headline news items, we will focus on fundamentals in this news article. And more specifically, U.S. corporate earnings.
The U.S. Q4 earnings season is about two-thirds complete and, once again, we are looking at fairly anemic growth.
This is the fourth consecutive quarter of low or zero growth in earnings. One more factor that doesn’t catch headlines is the lack of earnings growth for all of 2019. While nobody can deny 2019 was a good year for the S&P 500 Index INDEXSP: .INX which rose 31.5%, almost all of this came in the form of multiple expansion.
Deconstructing the index’s performance for the year, 2.6% came from dividends, 2.0% from the growth of earnings, and 26.9% from an expanding market multiple. This is in stark contrast to 2018, which witnessed a material contraction in the earnings multiple. (Chart 1 below).
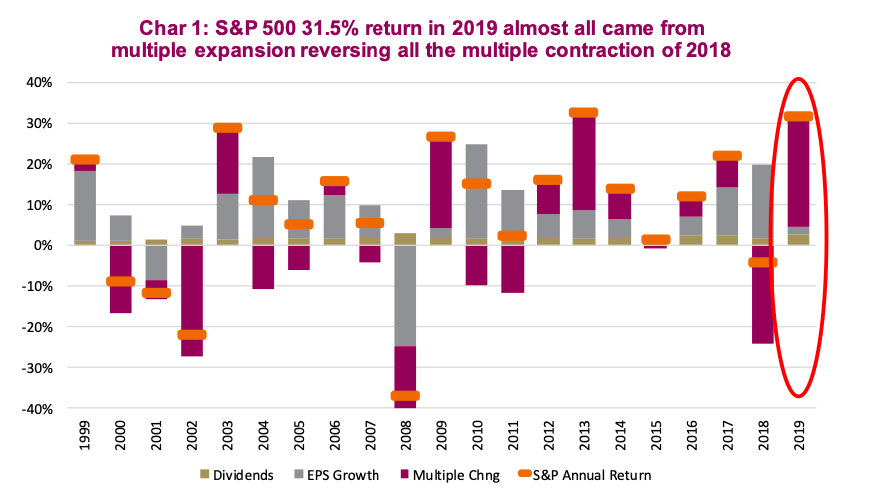
So now the question is how will things go in 2020? It is probably a safe bet that the earnings multiple will not boost market performance in 2020, as it is rare to see back-to-back years with a material multiple expansion. So, we are probably going to need performance to come from other sources if we hope to see a positive year in the markets. Typically, dividends contribute a few percentage points. And then there are earnings.
There is some good news. Even though earnings growth so far this earnings season has been barely positive, sales have continued to grow. In fact, sales or top-line growth has been coming in at about a 3.1% pace which is reasonable. It just hasn’t been translating into earnings growth which has been the norm for the past year or so.
Rising costs are starting to impact margins a little and this is how you get better sales growth and less earnings growth. Based on bottom-up consensus estimates, earnings growth remains in the low single digits in Q4 2019 and Q1 2020.
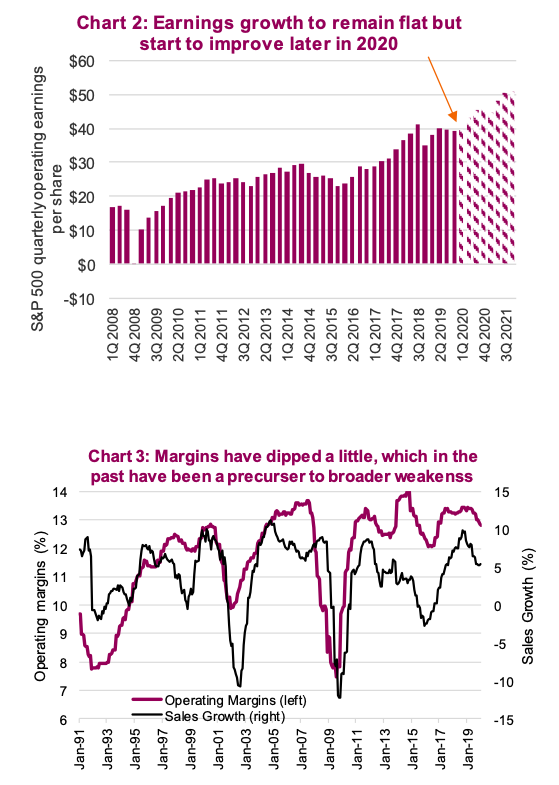
However, as 2020 progresses, estimates are for earnings growth to improve to low double digits in the second half of 2020. This would be a welcome development given elevated valuations in the market are at over 18x forward 12- month estimates.
However, a lot can happen between now and the second half. Coronavirus, for instance, is likely going to have a drag on economic activity, even if temporary. This will impact earnings for many multinationals, travel and leisure companies, and manufacturers with exposure to mainland China. Of course, it is too early to postulate the impact, but an additional drag is coming.
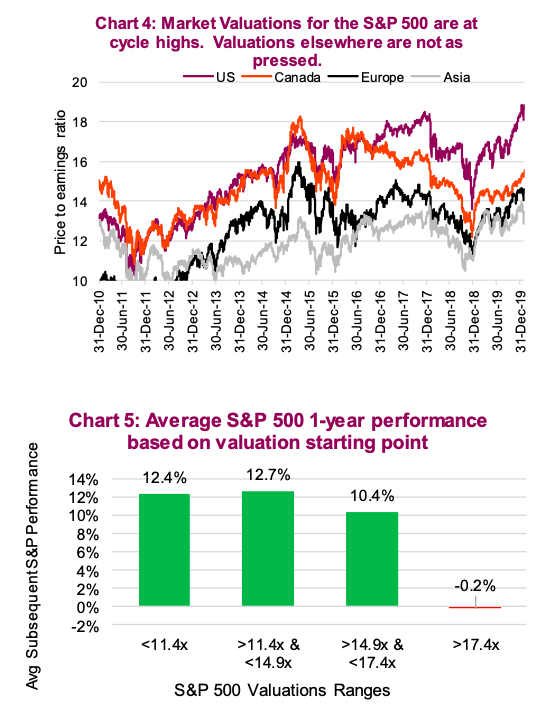
Falling profit margins are slightly concerning. With labour markets rather tight, we are starting to see some rising wage pressures. And it should not be lost on investors that preceeding periods of market weakness have experienced falling margins in the early stages. The good news is that while margins have fallen slightly to a little less than 13.0% from 13.5%, these are still healthy and fairly high by historical standards. (chart 3)
Overall though, the earnings season is going well. This is encouraging. But one additional aspect should temper views for U.S. equity market performance in 2020, and that is valuations.
The S&P 500 is trading over 18x forward earnings, which is roughly the highest level we have observed during the current bull market (Chart 4). We aren’t suggesting the multiple can’t move higher, but the odds are this will fall and not rise if history is a guide. This also highlights a good reason to consider taking some gains from the U.S. equity market and distribute globally. Valuations are not nearly as elevated elswhere in the world.
One last chart to ponder. We took the past 85 years of data for the S&P 500 and broke the valuation ranges into quartiles. The quartile with the cheapest valuations – those with a price-to-earnings ratio of less than 11.4x – experienced an average forward price return for the S&P 500 of 12.4%.
The second-cheapest quartile – between 11.4x and 14.9x – averaged a one-year forward return of 12.7%. The third quartile – with P/E ratios between 14.9 and 17.4 – averaged 10.4% forward returns. As the market becomes more expensive, the average return begins to decline. Finally, the most expensive quartile with a P/E ratio of more than 17.4x, (remember we are over 18x currently) experienced an average market return of -0.2% (Chart 5).
Now full disclosure, an average hides a lot of variance and many years that started with high valuations still managed to show gains. However, as valuations rise, you need to factor in lower return expectations. That is where we are today.
Earnings season is going well and we could see improved growth later in the year. That being said, valuations in the U.S. equity market are still in the upper historical ranges, which does make realizing further gains more difficult.
Source: All charts are sourced to Bloomberg L.P. and Richardson GMP unless otherwise stated.
Twitter: @ConnectedWealth
Any opinions expressed herein are solely those of the authors, and do not in any way represent the views or opinions of any other person or entity.


 Ready To Break Out?")
