After a strong multi-month late year rally above 4 dollars per bushel, Corn prices have spent much of the early going in 2015 in negative territory. The current pullback in Corn prices has been orderly, and thus far appears to be constructive, especially when considering headwinds like a stronger US Dollar.
Note that the pullback began from the targeted price resistance zone that I wrote about on December 19.
The latest USDA report (last week) was bitter sweet for both farmers and investors. Although the national corn yield estimate was lowered (price supportive) and demand a bit higher, export demand continues to lag (as a stronger dollar makes US Corn less attractive).
Export demand concerns have been eased by China’s approval of several genetically modified crop strains (i.e. GMO Corn). But even that news comes with questions: Will China follow through? And how much of a difference will it make? Note that, per the USDA, China reportedly cancelled their second purchase of soybeans in a week.
BUT, at the end of the day, “price” is what really matters. And there are a few factors that should give Corn investors some confidence over the coming weeks: 1) Corn did not get pulled down with the collapse in Crude Oil 2) Corn rallied in the face of a stronger US Dollar last year, and has held up pretty well on this pullback 3) Corn has not breached any technical support levels during this pullback.
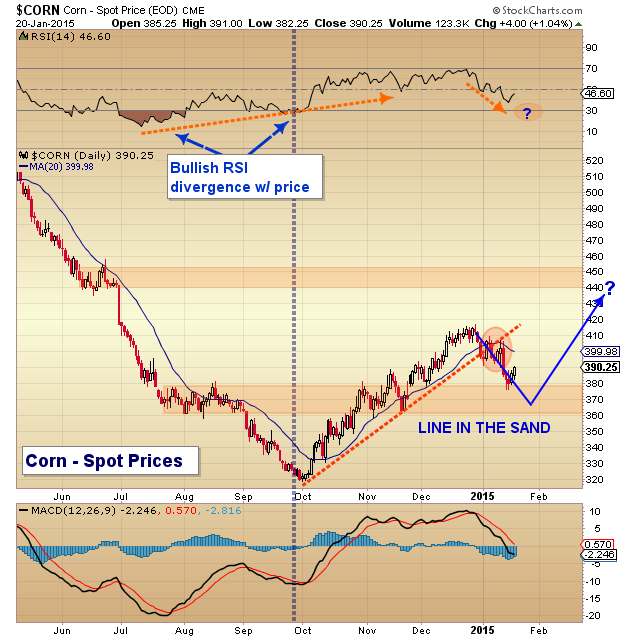
Finally, let’s take a look at a chart of spot prices and highlight some technical support levels to watch, as well as a potential price pattern. Back in early October, Corn prices bottomed while its Relative Strength Index (RSI) began to climb (a bullish RSI divergence). The RSI continued to climb until Corn prices topped in late December. And the first sell signal came when Corn broke its near-term uptrend line. The primary support zone for Corn is between $3.67-$3.80. Note that this support area is in line with retracements of 38.2 and 50 percent. The line in the sand would be a 61.8 percent retracements (3.56). If these levels hold, then Corn could regroup for a rally back towards its summer breakdown levels ($4.45-$4.60). But if they fail to hold, then Corn may be looking at a more significant decline to retest the October lows. Thanks for reading.
CORN Spot Price – Daily Chart
Thanks for reading.
Follow Andy on Twitter: @andrewnyquist
No position in any of the mentioned securities at the time of publication. Any opinions expressed herein are solely those of the author, and do not in any way represent the views or opinions of any other person or entity. Corn harvest image sourced from Wikipedia.

: Worrisome to Broader Market?")


