July corn futures closed down 7-CENTS per bushel week-on-week, finishing at $3.50 ¼.
Will Corn (NYSEARCA:CORN) continue its decline? What inputs could provide price support this summer?
Let’s take a look at several data inputs, trends, and indicators…
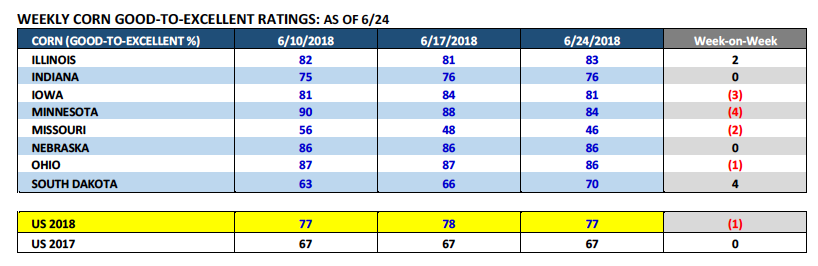
Monday’s Weekly Crop Progress report showed the U.S. corn good-to-excellent rating falling just 1% week-on-week. That said as of June 24th the U.S. corn crop was still rated 77% good-to-excellent versus 67% a year ago.
State specific results included Iowa and Minnesota seeing their state good-to-excellent ratings dropping off 3% and 4% respectively; however with both states still offering up good-to-excellent ratings in excess of 80%, the market seemed more than comfortable acknowledging that some seasonal decline in ratings was unavoidable from such elevated levels. Furthermore, Nebraska’s good-to-excellent rating was unchanged week-on-week at 86% with Illinois’s good-to-excellent rating improving 2% to 83%.
Overall, all the evidence points to the USDA likely increasing its current 2018/19 U.S. corn yield estimate of 174 bpa in the July 2018 WASDE report (released on 7/12/18). I wouldn’t discount the possibility of a U.S. corn yield projection in the 177 to 179 bpa ranges in that report, remembering again the 2017/18 U.S. corn yield was 176.6 bpa.
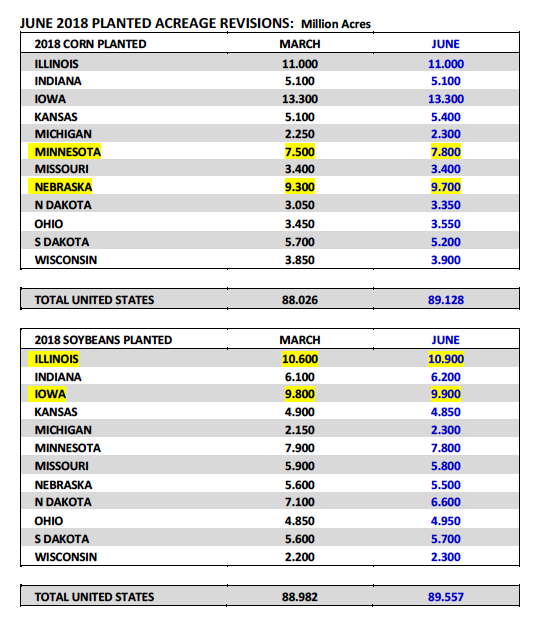
On Friday the USDA released its much anticipated June Acreage report, which offered both national and state-by-state corn planted acreage revisions versus the USDA’s March Prospective Plantings estimates released back on 3/30.
The USDA increased total 2018/19 U.S. corn planted acreage to 89.128 million acres versus their March forecast of 88.062 million and the average trade guess of 88.562 million. Notable state planted acreage increases included Minnesota up 300,000 acres versus March to 7.8 million, and Nebraska up 400,000 acres versus March to 9.7 million (see page 2). Total corn planted acreage in Iowa, Illinois, and Indiana was unchanged versus March at 13.3 million acres, 11.0 million acres, and 5.1 million acres respectively. Once again those 5 states account for approximately 53% of the total U.S. corn planted acreage base and just over 60% of total U.S. corn production.
That said what is the potential impact of the USDA’s acreage increase on the 2018/19 U.S. corn S&D moving forward?
After applying the USDA’s revised corn acreage forecast, as well as, a U.S. corn yield estimate of 177 bpa (+3 bpa versus the USDA’s June forecast), I have total 2018/19 U.S. corn production improving to 14.473 billion bushels in the July 2018 WASDE report. That’s up 433 million bushels from June.
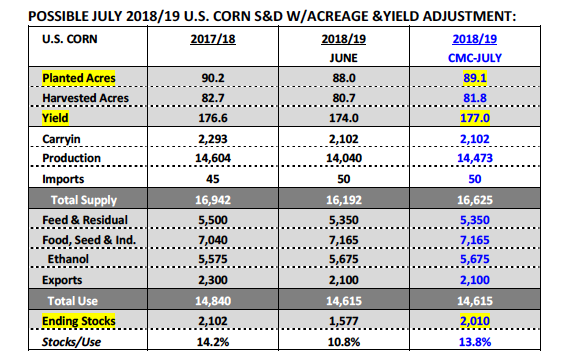
Assuming the USDA leaves both carryin stocks and total demand unchanged, the 2018/19 U.S. corn ending stocks figure would increase to 2.010 billion bushels versus 1.577 billion bushels a month ago.
How Bearish is a 2.0 billion bushel U.S. corn carryout?
To answer that I think you have to look at where July corn futures are currently trading at in relationship to both 2016 and 2017, considering both years featured 2.0 billion bushel plus U.S. corn ending stocks. On 6/30/2016 CN closed at $3.58 ¾. On 6/30/2017 CN closed at $3.70 ½. On Friday, 6/29/2018 CN closed at $3.50 ¼, BELOW the previous 2-years.Therefore as far as trying to determine whether or not July 2018 corn futures are over-priced relative to the possibility of 2018/19 U.S. corn ending stocks moving back over 2.0 billion bushels in the July 2018 WASDE report…I would have to say no. Traders have essentially already priced that in.
July Corn Futures Market Forecast
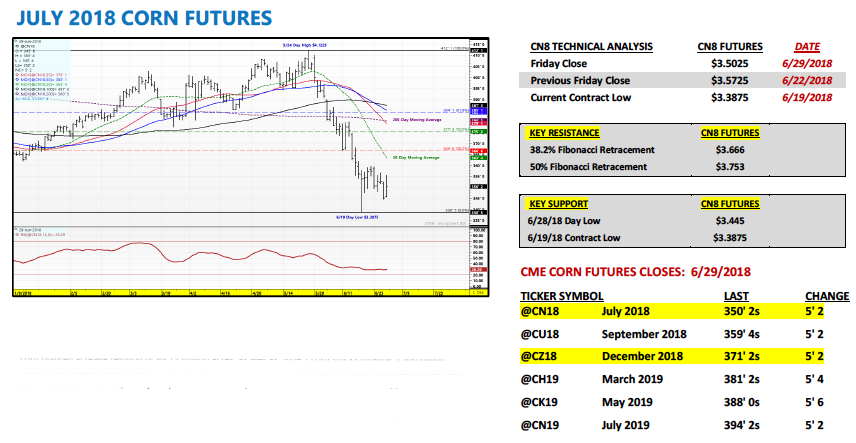
The bad news for Corn Bulls…July corn futures closed lower yet again week-on-week. The good news…July corn futures closed up 5 ¼-cents on Friday afternoon.
DESPITE what on paper appeared to be a Bearish U.S. corn planted acreage revision of 89.13 million acres, as well as, June 1 corn stocks totaling 5.306 billion bushels, 38 million bushels higher than the average trade guess. Presumably if there was to be a final, fatal blow to the corn market, Friday’s reports should have provided it. However that didn’t happen…
How then did the corn market manage a higher close on Friday, 6/29?
The corn market’s been under intense selling pressure since establishing its calendar year high in July corn futures of $4.12 ¼ on May 24th. Since then the high-to-low price break has been 73 ½-cents per bushel. A bevy of price negative storylines have been thrown at the corn (and soybean) market including the still unresolved trade war with China, strong crop condition ratings, as well as, the assumption that the USDA would indeed increase U.S. corn acreage in the June 29thAcreage report.
Two of those three “price negatives” still remain in play; however at least for the moment the fear of how much of an acreage increase we might see in the June report has been quantified. Now traders can start assessing potential pollination temperatures and focus almost exclusively on the July weather pattern. The production variable moving forward has therefore been narrowed to one…yield.
That said…NOAA’s latest 6 to 10-day and 8 to 14-day forecasts finally some hot/dry ridging in the Corn Belt, persisting into the second week of July.
With the Managed Money now net short -60,319 corn contracts as of the market closes on 6/26…I think it’s safe to say the market has no weather premium reflected in current futures prices. IF the hot/dry weather pattern can hold into the 4thof July…Corn Bulls have a shot.
Twitter: @MarcusLudtke
Author hedges corn futures and may have a position at the time of publication. Any opinions expressed herein are solely those of the author, and do not in any way represent the views or opinions of any other person or entity.
Data References:
- USDA United States Department of Ag
- EIA Energy Information Association
- NASS National Agricultural Statistics Service


