July corn futures moved slightly lower this week, closing down 3 ¾-cents per bushel week-on-week, finishing on Friday (6/16) at $3.84.
Corn futures although closing lower on the week did manage to climb out of a big hole following Monday’s (6/12) down 10 ½-cents per bushel trading session.
Weekly Corn Price Drivers (6/12/17 – 6/16/17)
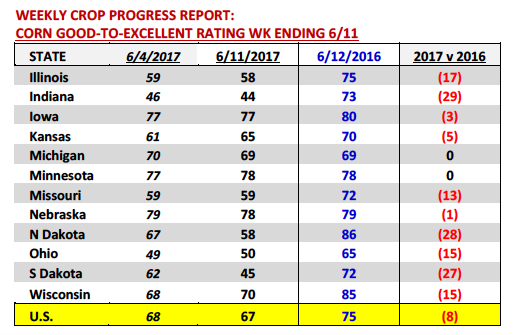
U.S. Corn Crop Ratings: Monday’s Crop Progress report showed the U.S. corn good-to-excellent rating declining 1% week-on-week to 67% as of the week ending June 11th versus 75% in 2016. This was essentially in-line with trade expectations.
However, this week’s rating once again underscored that all is not well in several key corn producing states across the Midwest. South Dakota in particular saw its state good-to-excellent rating endure a steep 17% weekly decline to 45%. Meanwhile Illinois and Indiana experienced additional cuts to what were already low good-to-excellent ratings issued a week ago. Illinois’s good-to-excellent rating dropped to 58% versus 75% in 2016 (-17%) with Indiana’s good-to-excellent rating falling to 44% versus 73% in 2016 (-29%). Strong ratings reported for Minnesota, Iowa, and Nebraska continued to provide a momentary and partial offset to the deterioration in crop conditions in the states listed above; however I would still argue those 3 states alone can’t carry the U.S. to a national corn yield of 170 bushels per acre in 2017.
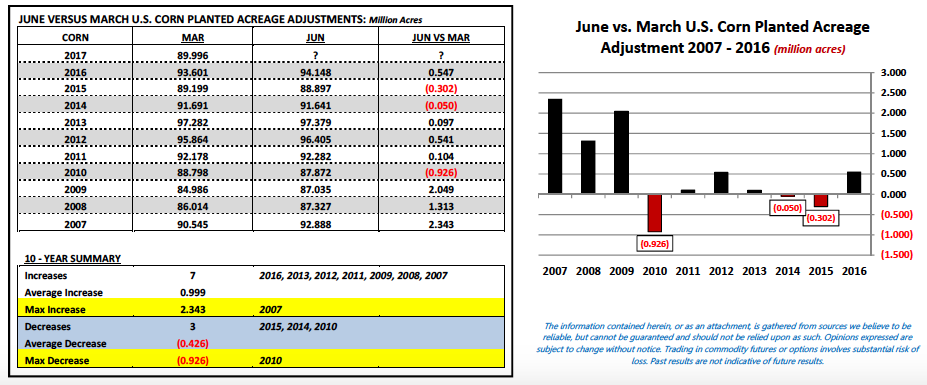
June 30th Corn Acreage Reduction Probability & Production Impact: As I mentioned in last week’s commentary the USDA’s June 30th Acreage report is becoming more and more of a talking point in various trade circles with a number of private analysts anticipating a U.S. corn planted acreage reduction of 500,000 to 1.25 million acres in this year’s June forecast. Theoretically this would lower U.S planted corn acreage to a low-to-high range of approximately 88.75 to 89.5 million acres versus the USDA’s March 31st Prospective Plantings estimate of 90 million. It should be noted however that over the last 10 years on only 3 occasions has the USDA lowered U.S. planted corn acreage in the June report (versus the March 31st forecast); the largest decrease coming in 2010 totaling -926,000 acres.
Let’s assume for a moment the USDA does indeed lower U.S. planted corn acreage 1.0 million acres, what would be the impact on total 2017/18 U.S. corn production in the USDA’s July 2017 WASDE report? If the U.S. corn yield remains unchanged at 170.7 bpa, U.S. corn production would only fall approximately 170 million bushels. That on its own likely wouldn’t be enough to justify a price move to $4.40 to $4.50 in July corn futures considering the impact on U.S. corn ending stocks would be negligible. Under this scenario (assuming no other changes were made to U.S beginning stocks and/or demand) 2017/18 U.S. corn ending stocks would still pencil back at a very comfortable 1.940 billion bushels. HOWEVER if the USDA lowered both acreage and the U.S. corn yield 3 bushels per acre to 167.7 bpa, the combination of both adjustments would create a 415 million bushel decline in production. This in turn would push U.S. corn ending stocks below 1.7 billion bushels while dropping the U.S. corn stocks-to-use ratio to 11.9% (which would be the lowest stocks-to-use ratio since 2013/14). This isn’t $5.00 corn futures Bullish; however it might be enough to generate a push to $4.40 to $4.50 per bushel.
Pricing Considerations For This Week: “BULL” VERSUS “BEAR” TUG-OF-WAR CONTINUES…
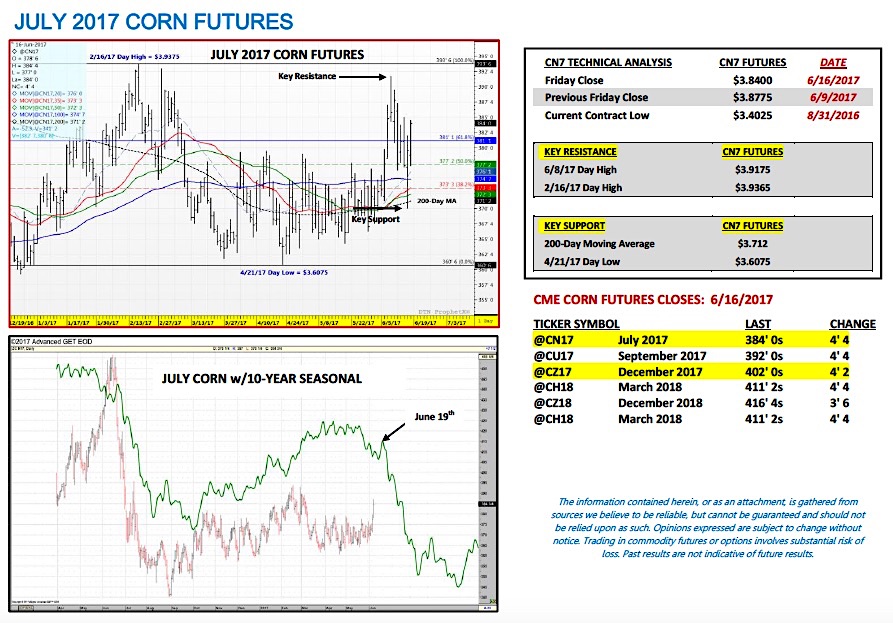
Bullish corn price defense hinges on crop ratings, weather, and acreage – This week’s price action and erratic trading pattern (closing down 10 ½-cents on Monday, closing up 3 ¾-cents on Tuesday) was a perfect representation of the typical up and down price movement traders have become accustomed to seeing during the month of June. That said this week Corn Bulls suffered a minor setback both from a price perspective, as well as, a “dominant market dialogue” viewpoint. Despite the 1% decline in the U.S. corn good-to-excellent rating on Monday afternoon and 8% disadvantage versus a year ago (currently rated 67% good-to-excellent versus 75% in 2016); traders instead opted to focus on improving rain prospects and cooler temperatures for the Eastern Corn Belt over the next 6 to 10-days (see models on page 4). The assumption then being that crop ratings in Illinois, Indiana, and Ohio (which are sizably behind a year ago) will improve in coming weeks. This mentality therefore trumped any over-reaction to current crop conditions and prevented a re-test of the day high from last week on 6/8/17 of $3.91 ¾.
The other blow to Corn Bulls was Informa’s June Acreage forecast for U.S. corn. On Tuesday Informa issued a June planted corn acreage estimate of 90.186 million acres versus the USDA’s March 31st Prospective Plantings projection of 89.996 million. As I mentioned in my previous comments, Corn Bulls absolutely need the USDA’s June Acreage report to show a material reduction. If that report were to show an increase (which I haven’t seen speculated from anyone other than Informa), the landscape for Corn Bulls and rallies up to $4.00 in July corn/$4.20 December corn futures becomes incredibly more difficult. I still believe the vast majority of traders anticipate an acreage decrease on June 30th; however Informa’s forecast certainly threw a layer of doubt into the market mix, which I do believe is forcing some to question the strength of their original acreage biases going into that report.
Corn Bears won the week; however it was far from a “knockout” with adjustments to the weather still reigning supreme moving forward. It won’t take much of a perceived Bullish change in the forecast to push July corn futures back toward $3.90 early next week. We still have to pay attention and respect the 5 and 10-year July corn seasonal, which turns lower on June 19th. Stay tuned…
Thanks for reading.
Twitter: @MarcusLudtke
Author hedges corn futures and may have a position at the time of publication. Any opinions expressed herein are solely those of the author, and do not in any way represent the views or opinions of any other person or entity.
Data References:
- USDA United States Department of Ag
- EIA Energy Information Association
- NASS National Agricultural Statistics Service


