There has been a lot of indecision in the financial markets.
And today we highlight some of that indecision via the price of Copper.
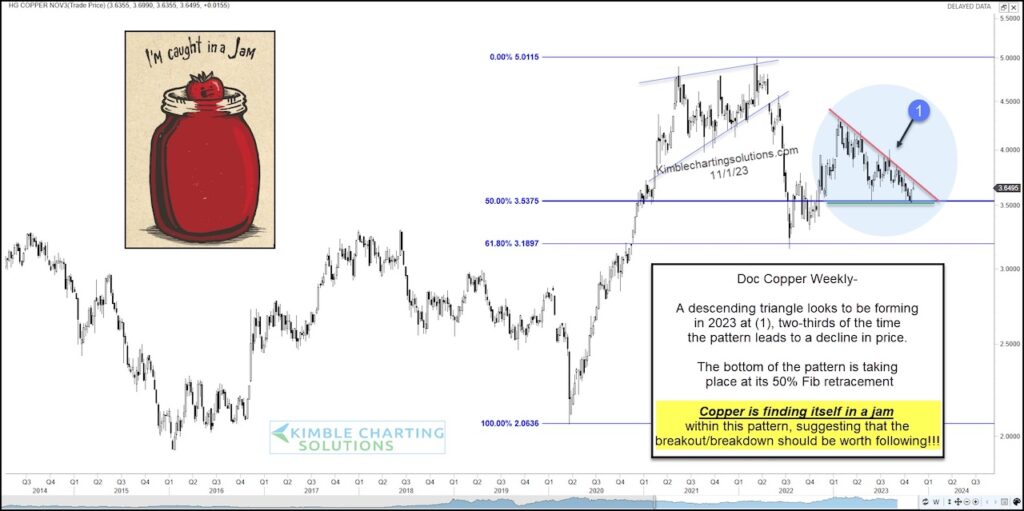
On today’s “weekly” chart of Doc Copper you can see that the price of Copper is getting all jammed up at (1) between falling resistance and lateral support. Note that lateral support is also the 50% Fibonacci level.
Will this dual support hold? The trading price pattern has taken the shape of a descending triangle pattern and typically breaks to the downside. We’ll see.
A breakdown here may indicate that the economy is in slowdown mode and the Fed is done raising interest rates…
How this pattern resolves itself should send an important macro message to investors about recession, state of the economy and interest rates
Copper “weekly” Chart
Note that KimbleCharting is offering a 2 week Free trial to See It Market readers. Just send me an email to services@kimblechartingsolutions.com for details to get set up.
Twitter: @KimbleCharting
Any opinions expressed herein are solely those of the author, and do not in any way represent the views or opinions of any other person or entity.


