The strength of the Copper rally during the past 13 months has convinced us to move the bigger-picture bullish count to the forefront.
Even so, Elliott wave considerations and calculated price resistance suggest a sizable downward correction is due for Copper and the Copper ETF (NYSEARCA:JJC).
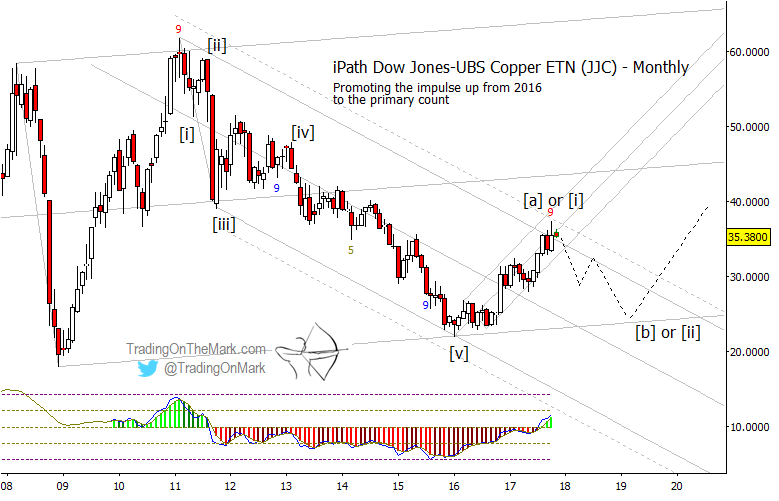
In autumn 2016 copper prices broke emphatically out of the consolidation range that we had been treating as a potential bear flag. The subsequent wave structure looks impulsive on a monthly time frame, and closer analysis on a weekly chart indicates the upward count should be near completion. Meanwhile, the futures price (not shown) faces important resistance nearby, while the iPath Dow Jones UBS Copper ETN (NYSEArca: JJC) is testing multiple types of geometric resistance.
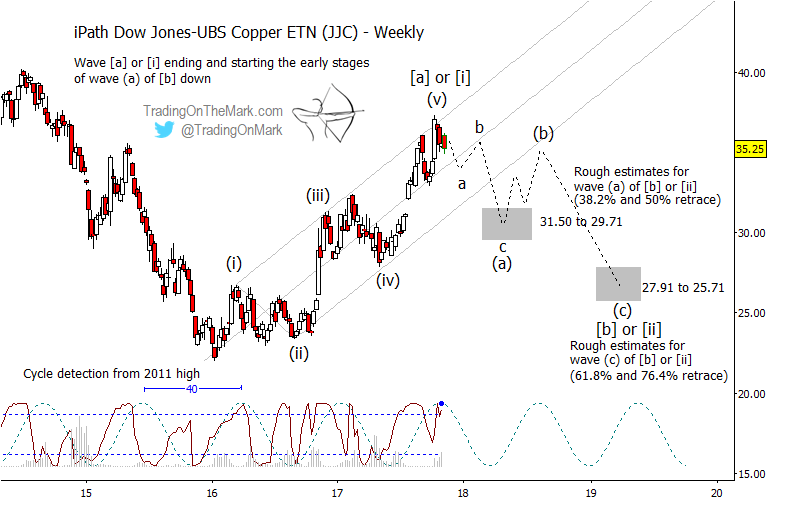
If a reversal begins from near the current area, then we expect the next move to behave approximately as we have sketched on the monthly JJC chart below. The downward sloping channel may also guide the decline until it finds solid support.
Copper Monthly Bar Chart – Elliott Wave
Even if a downward correction takes place as we expect, it is too early to be certain what kind of larger structure may be forming. Thus we have labeled the 2016-17 rally as either wave [a] or wave [i], and the correction would be either wave [b] or [ii]. In this case the distinction doesn’t matter much from a trader’s perspective.
On the next chart, note that a 40-week cycle has fit well with price swings in recent years and the cycle is currently near its peak. The timing is compatible with a downward turn around now, and projecting the cycle forward suggests how a three-wave correction might play out between now and 2019.
Copper Monthly Bar Chart – Elliott Wave
The gray target boxes on the weekly chart show likely areas to watch during a downward correction. If the recently tested resistance holds, then standard Fibonacci retracement measurements of 38.2% and 50% mark the area where the first part of a correction might pause, corresponding to the zone between 31.50 and 29.71. A deeper 61.8-76.4% retrace might complete the entirety of the correction later, suggesting that the zone from 27.91 to 25.71 might be tested a bit more than a year from now.
Our newly updated website includes a whole section for ETFs. Come visit!
Twitter: @TradingOnMark
No position in any of the mentioned securities at the time of publication. Any opinions expressed herein are solely those of the author, and do not in any way represent the views or opinions of any other person or entity.


