The presence of flat 200 day moving averages throughout many of the US Stock Market Indices and sectors, combined with a few other factors, is causing me to maintain a neutral / bearish stance toward equities for the time being.
Fortunately, as a technician I can take advantage of opportunities in other non-correlated liquid asset classes when I’d prefer to avoid equity exposure on the long side. Today, I’ll turn our attention to a beaten down commodity with potential for a countertrend rally – Copper.
Copper looks good on the long side for a number of reasons. And a copper rally could just be getting started.
- Copper has no correlation to the S&P 500, which is great given my view on equities at the moment.
- Commercial hedgers are net long and getting longer, with their position slowly creeping its way back toward all-time highs.
- In terms of public sentiment, pessimism is near levels only registered a few times over the past few years, levels not exceeded since late 2001.
- Seasonality is pretty neutral into year end. While not a major tailwind, it’s good to be aware that history would suggest it shouldn’t be a headwind for higher prices going forward. If Copper prices do manage to gain traction though, it’s important to notice that Jan-April is the best 4 month period of the year for Copper.
- While still broken structurally, Copper has met my downside price target from a tactical perspective, thus opening the door for the possibility of a mean reversion / counter-trend trade and a Copper rally.
Overall, this backdrop for Copper prices looks like it has the potential to support a countertrend Copper rally. But let’s take a look at what prices are indicating.
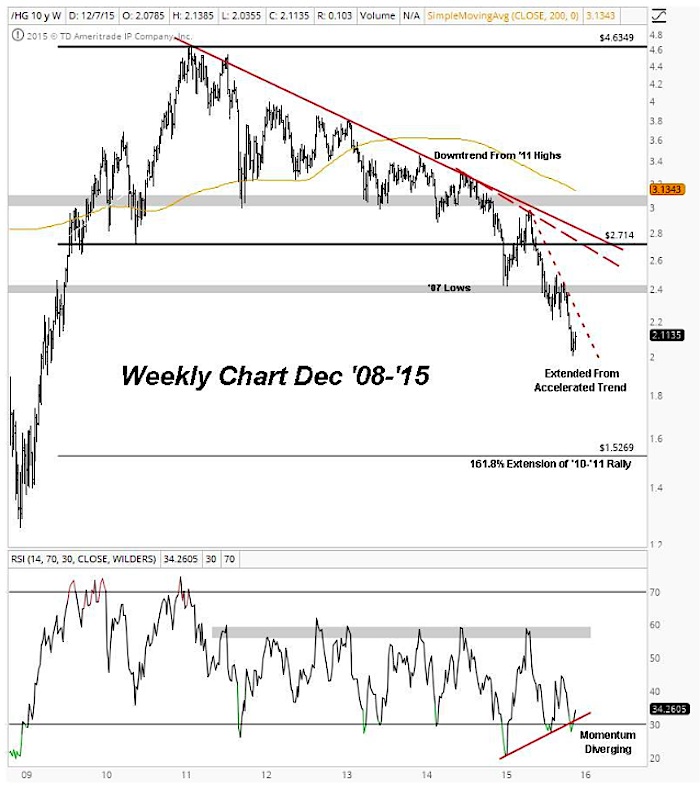
From a structural perspective, Copper has been in a downtrend for years, but prices really began accelerating lower once long term support near 3.00 was broken last year. My structural downside price target for Copper is near the ’09 lows at the 161.8% extension of the 2010-2011 rally, but prices have recently gotten really extended from the major downtrend lines that have helped define this decline. Additionally, momentum has diverged positively at these recent lows as prices have stabilized for a few weeks, suggesting that Copper prices may retrace from here.
Copper Futures – Weekly Chart
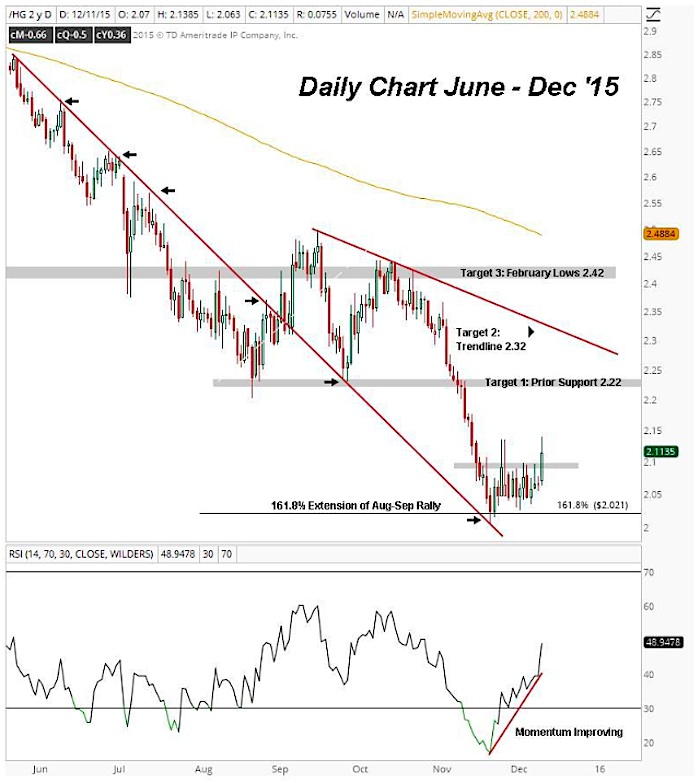
On the daily chart prices have reached my tactical downside target near 2.02, based on the 161.8% extension of the Aug-Sep rally, which also corresponded with a successful retest of the downtrend line from the May highs. Copper prices have since consolidated for roughly 2-3 weeks and have since broken out of this range to the upside, as momentum continues to improve. This improving price action, combined with the fact that Copper prices are roughly 18% below their downward sloping 200 day moving average, suggest that this may be the beginning of a countertrend rally.
Copper Futures – Daily Chart
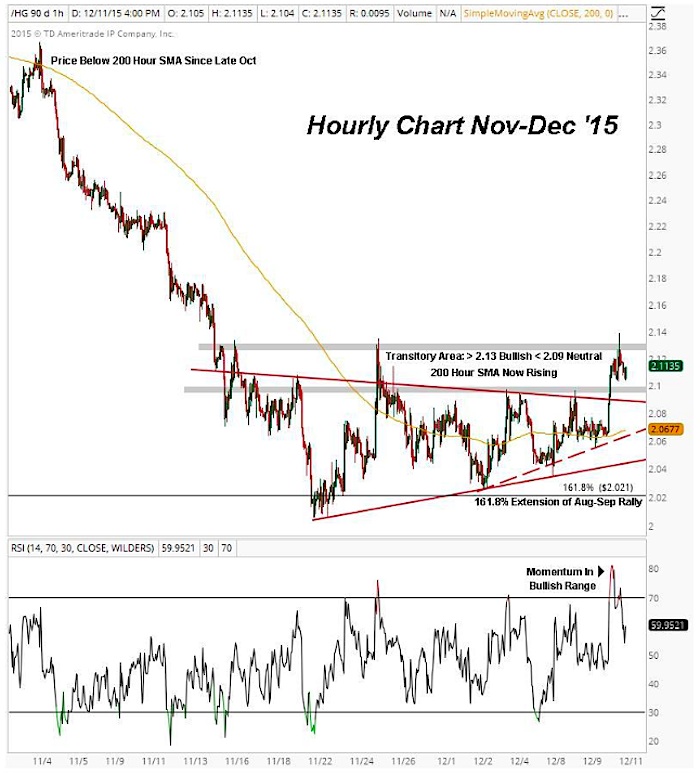
The hourly chart shows a more in-depth look at the range that has developed, as well as the corresponding breakout that occured on Friday.
The important aspect of this chart is the shift from a downtrend to an uptrend that is represented by the change in slope of the 200 hour moving average that resulted from weeks of consolidation. This moving average has been downward sloping since late October, acting as a major headwind for prices, but now that it has shifted and began rising, it can begin to act as a tailwind for higher prices.
The weight of evidence sugests that further strength is coming, but a bullish development would be a breakout above the recent highs near 2.13. This would suggest that the Copper rally has legs. If this range resolves to the downside by breaking 2.08-2.09, then my view will shift back to neutral.
Copper Futures – Hourly Chart
The Bottom Line: With sentiment as pessimistic as it is and price action improving, it may be time to look at Copper on the long side. The weight of evidence suggests that further strength in this market can be expected, but more cautious traders can wait for a breakout above the recent highs of 2.13 on a closing basis before getting involved on the long side.
From a risk management perspective there is no reason to be long this market unless we remain above 2.08 on a closing basis with the 200 hour simple moving average rising. If Copper prices resolve to the downside and close below the “transitory range” discussed on the hourly chart, it will confirm a failed breakout and warrant a neutral stance until Copper prices can confirm a breakout above 2.13.
Should a Copper rally continue to develop, longs can use price targets of 2.22, 2.32, and 2.42, which are outlined on the daily chart as points of reference.
Overall I’m looking for Copper prices to retest its 200 day moving average near target 3, which is roughly 15% above current prices. Assuming a stop below 2.08 and utilizing 2.42 as a primary objective, the risk/reward for this trade is roughly 10:1 from current levels. That’s good enough for me.
As always, if you have any questions feel free to reach out and I’ll get back to you as soon as I can.
Thanks for reading.
Twitter: @BruniCharting
Read more from Tom on Dorm Room Capital.
The author has a position in Copper at the time of publication. Any opinions expressed herein are solely those of the author, and do not in any way represent the views or opinions of any other person or entity.


