I continue to receive questions on Twitter regarding the agonizing decline for the Consumer Staple Index in 2018 (we have no stake).
As of this writing, consumer staples stocks are down -11% year to date as measured by the iShares Consumer Staples ETF (XLP).
Just for general knowledge, the main constituents of the index are Pepsi (PEP), Coca-Cola (KO), Procter & Gamble (PG), Walmart (WMT), and Costco (COST). These are high-quality names that everyone is likely familiar with.
The Consumer Staples Index is garnering attention due to its weakness on an absolute basis, but even more so as compared to the Consumer Discretionary Index.
Here’s a relative price chart which shows discretionary vs. staple stocks.
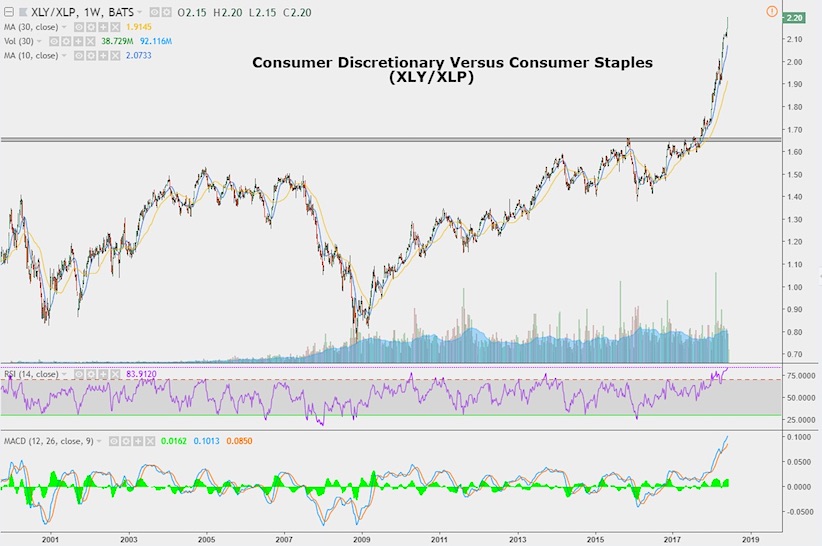
We track this relationship in our internal Avory Weekly Book as it is visible evidence of investor psychology. In August/September of 2017 discretionary stocks roared higher relative to staple names. This all-time high in the relative ratio was an internal bullish indicator for equities more broadly and has sustained its move.
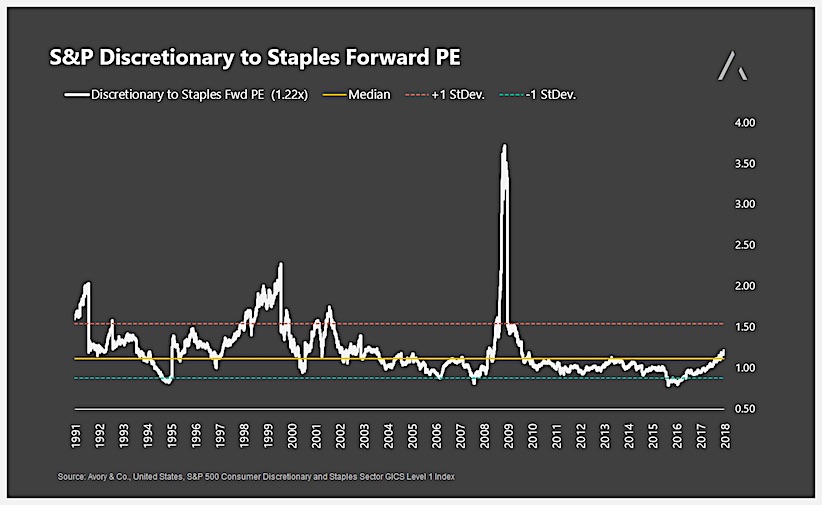
Given the rapid move higher, many are calling for this ratio to mean revert. While statisticians could have a suitable argument, I wanted to look under the hood from a valuation perspective. The chart below highlights the relative forward PE ratio of discretionary companies to staples. To be clear, this is a relative valuation chart, while above is a relative price chart. The yellow line is the median forward PE since 1990, and the red line indicates the upper bound of normal readings. Therefore, while the price chart does highlight a parabolic move higher since 2017, the valuation reading suggests that a mean reversion may have already taken place on a valuation basis…
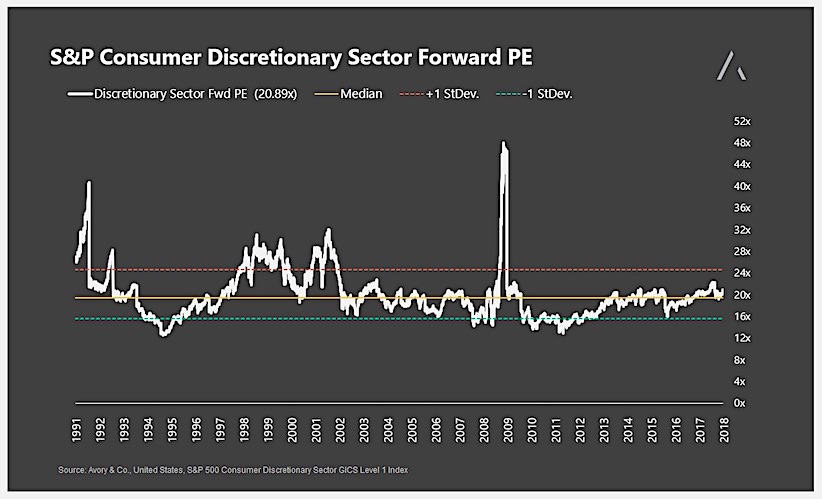
To go a step further, I wanted to show the absolute valuations for both sectors. First, let’s start with the discretionary sector. In 2016 the sector was hitting the lower bound of reasonable valuations, suggesting that the sector may have been outright cheap at the time. Since then, valuations have migrated back towards the yellow median line since 1990.
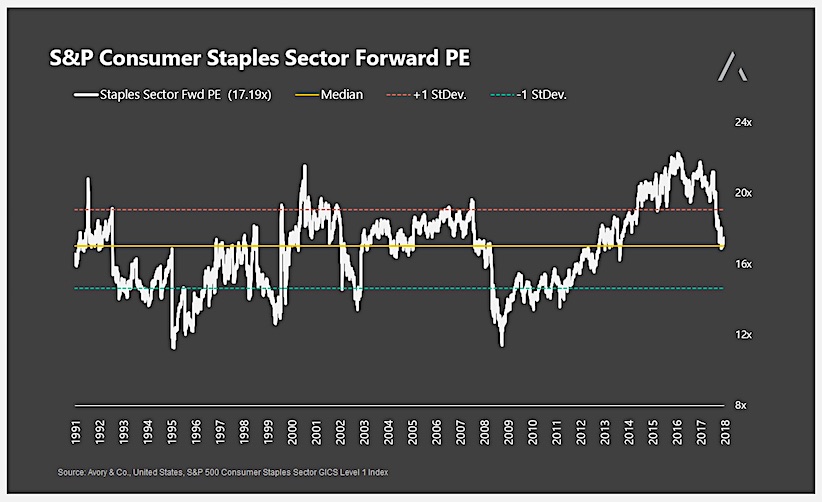
In comparison, consumer staples were hitting all-time high valuations in 2016 and have reverted lower to its median line since 1990.
To conclude, it is evident that the relative price chart of discretionary companies to staple companies may seem stretched by most observers.
However, digging a little deeper I would say that the move seemed warranted if median valuations mean anything to you as an investor. With the relative valuation measure now back at median levels, the next move is unclear and will likely be dictated by operating performance…
Twitter: @_SeanDavid
Any opinions expressed herein are solely those of the author, and do not in any way represent the views or opinions of any other person or entity.

: Showing Some Signs of Emerging Strength")
