If consumption is approximately 70% of US GDP, then inputs to the consumer are critical to the stability and growth of the economy.
So let’s discuss what current indicators are saying about the consumer.
One chart I like to look at regularly is our cycle indicator.
Here we take the rolling 24-month change in both oil prices and the 10-year yield. Oil prices are vital as they feed through many input costs to consumers.
For example, using the latest annual BLS data, yearly transportation costs make up roughly 15% of total annual consumer spend, and 12% of income. Therefore increases in oil prices can affect consumer input costs and act as a gas tax.
The second input is the action in interest rates. Rates flow through to the consumer through outstanding liabilities, but also through annual costs. Today, roughly 65% of consumer liabilities come in the form of a mortgage. On a yearly basis, consumers spend approximately 25% of their income on housing-related expenses. Additionally, consumers have alternative liabilities such as 10% of outstanding obligations on student loans, 10% on credit card debt, and another 10% on auto loans. It is for this reason why rising rates can impact consumption habits. Now to the chart…
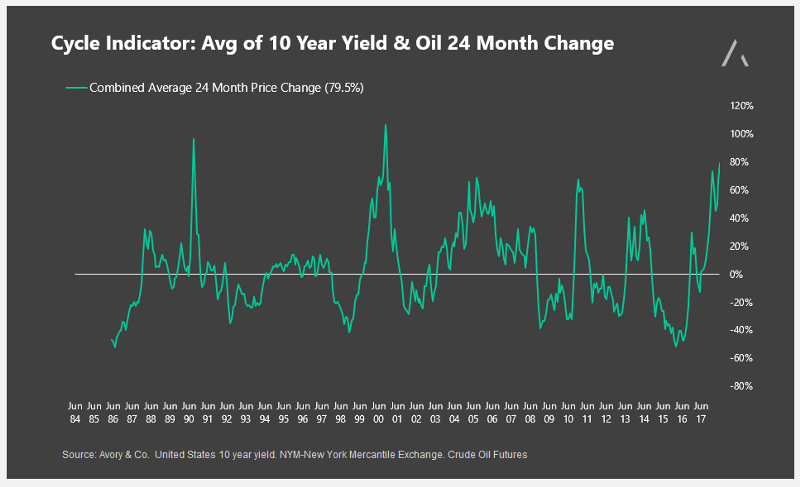
We took the average 24-month rate of change for both oil and the 10-year yield and rolled them back to 1984. Over the last 24 months, the combined average growth rate is 79.5%, the highest since 2000. Another anecdote is looking back at what happened to the economy when this indicator was elevated. The reading peaked in 1990, 2000, 2006, and 2011. While not the main cause per-say, these periods were followed by weak consumer spending.
So, What does this all mean?
Consumer input costs are rising as credit remains elevated. The reality is that this combination doesn’t typically lead to positive outcomes overall. I believe if this persists that we should expect weaker consumption figures in the back half of 2018, early 2019.
Twitter: @_SeanDavid
Any opinions expressed herein are solely those of the author, and do not in any way represent the views or opinions of any other person or entity.
")

 Trading Near Top Of Price Range")
")
