Thomson Reuters Equal-Weighted Commodity Index Chart
It’s been a rough decade for commodities… but there may be light at the end of the tunnel.
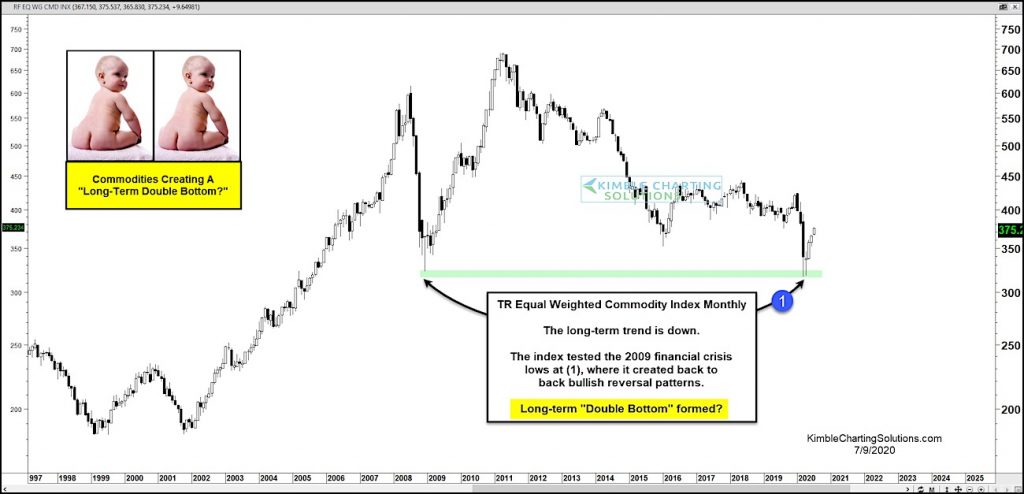
As you can see in today’s chart, the Equal Weight Commodity Index made new decade lows this spring at (1).
In general, this is bearish. BUT, prices reversed higher with a little attitude. Precious metals has been strong and crude oil is well off its lows.
This has given life to a potential double bottom pattern, as this year’s lows came in and around the 2009 financial crisis lows.
Is it possible that Commodities have created a long-term double bottom at (1)? Stay tuned!
Note that KimbleCharting is offering a 2 week Free trial to See It Market readers. Just send me an email to services@kimblechartingsolutions.com for details to get set up.
Twitter: @KimbleCharting
Any opinions expressed herein are solely those of the author, and do not in any way represent the views or opinions of any other person or entity.


