The commodities space has dealt investors a difficult hand over the past decade.
Back in 2010/11, the Thomson Reuters Equal Weight Commodities Index peaked following a fast and furious move to the upside.
Since then, Commodities have been a mess. Failed rallies and rangebound trade have caused frustration across crude oil, gold, corn, and other commodities.
BUT, the most promising of any rally attempts has come over the past couple of years.
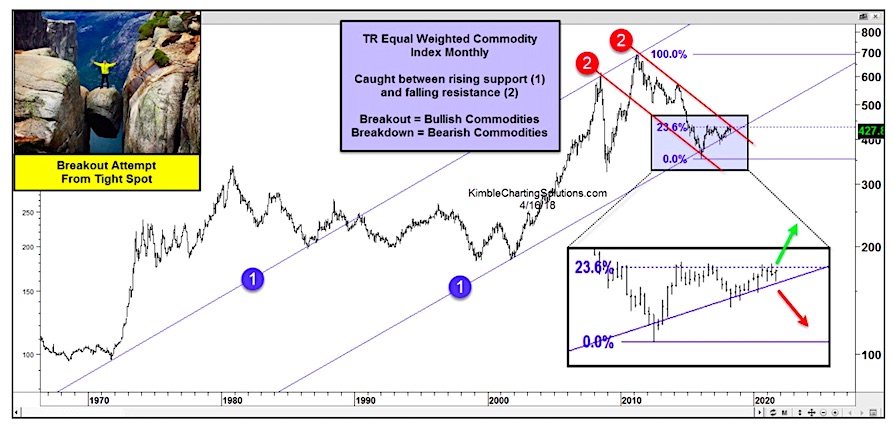
In the chart below, you can see the declining channel that commodities have been in for the past 8 years or so (point 2). But the rally has brought commodities to a crossroads… and a decision is nearing.
The recent rally is straddling the uptrend line from 2001 (point 1). This is applying upward pressure and acting as support. However, the index is finding resistance at the 23.6% Fibonacci level and 8 year downtrend line. This is applying downward pressure. Note that the 23.6% Fib often serves as a trend change indicator.
This “squeezing” will eventually lead to the next directional move. Stay tuned!
Thomson Reuters Equal Weight Commodities Index – 50+ Year Chart
Note that KimbleCharting is offering a 30 day Free trial to See It Market readers. Just send me an email to services@kimblechartingsolutions.com for details to get set up.
Twitter: @KimbleCharting
Any opinions expressed herein are solely those of the author, and do not in any way represent the views or opinions of any other person or entity.

: Showing Some Signs of Emerging Strength")
