The following is a recap of the recent Commitment Of Traders (COT Report) released by the CFTC (Commodity Futures Trading Commission) looking at COT data and futures positions of non-commercial holdings as of November 22.
Note that the change in COT report data is week-over-week. Excerpts of this blog post originally appeared on Paban’s blog.
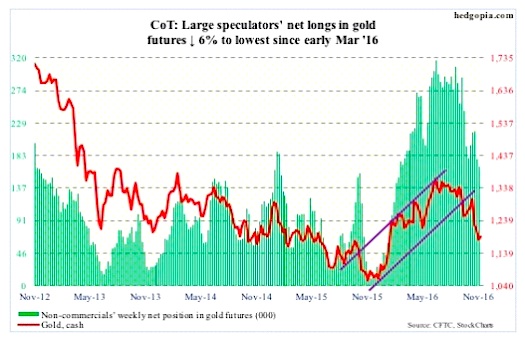
GOLD
Time for gold bugs to step up to the plate.
On Wednesday last week, gold prices dropped to $1170.3, before rising a tad. Support around here – $1,180-ish – goes back to November 2009. It is a must-hold price area.
Flows are still not helping. In the week ended Wednesday last week, the SPDR Gold ETF (NYSEARCA:GLD), lost $1.4 billion, having lost $1.2 billion in the prior week (courtesy of ETF.com).
Needlessly to say, the metal is oversold, with the daily RSI sub-20 last Friday. A bounce is due. Should gold prices push higher and sustain, it is possible it would be carving out the right shoulder of a three-plus-year inverse head-and-shoulders pattern.
Currently net long 167.1k, down 10.6k.
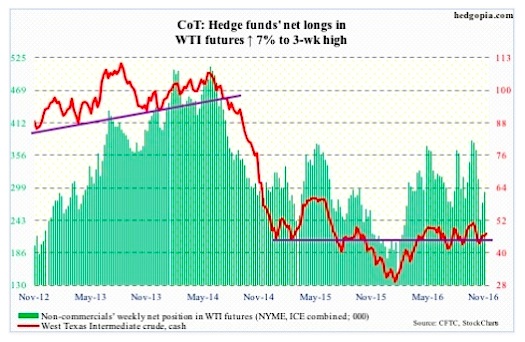
CRUDE OIL
Amidst all the optimism around the November 30 OPEC meeting comes news that both Iran and Iraq are seeking exemptions from production cutback plans. Combined, the two produce nearly a quarter of OPEC production.
In Algiers in September, OPEC decided to cut production to between 32.5 million barrels per day and 33 mb/d. The IEA puts August oil production at 33.5 mb/d. Since then, an increase in Libyan and Nigerian production has boosted output to 33.8 mb/d. Even to get to the goal reached in Algiers, the amount that needs to be cut has gone up.
Amidst this, in the week ended November 18, U.S. crude oil stocks fell by 1.3 million barrels to 489 million barrels. The prior week was at an 11-week high.
Crude oil imports dropped, too, by 845,000 barrels per day to 7.6 million b/d.
Refinery utilization rose by 1.6 percentage points to 90.8 – a nine-week high.
Crude oil production, however, rose a tad, by 9,000 b/d, to 8.7 mb/d.
Gasoline and distillate stocks rose – by 2.3 million barrels to 224 million barrels and by 327,000 barrels to 149.2 million barrels, respectively.
Where crude oil goes from here depends on the follow through action (after the OPEC induced rally) in the days ahead. Prior to OPEC, spot West Texas Intermediate crude oil last week rallied 3.5 percent, and past support-turned-resistance $46-plus.
Currently net long 292.4k, up 19k.
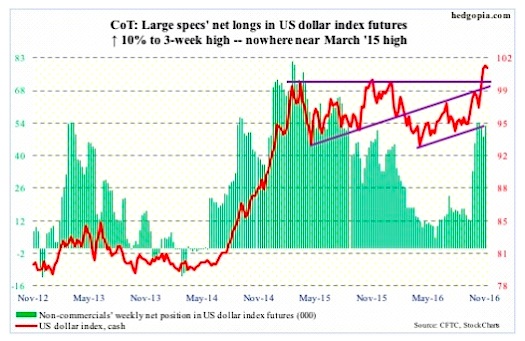
US DOLLAR INDEX
The cash broke out to a 13-year high – past prior two peaks of March and November last year. On a daily and weekly basis in particular, the dollar index is grossly overbought, and is beginning to flash signs of fatigue, with last week a spinning top.
It has also reached a crucial stage technically – .618 Fibonacci retracement of the January 2002-March 2008 decline. More often than not, this can be a spot where momentum can reverse, or at least pause.
Yesterday, there was a breakout retest. This was a first test and was successful, but it is unlikely this will continue to hold in the days/weeks to come.
Non-commercials have decided not to aggressively jump on the dollar bandwagon.
Currently net long 53.2k, up 4.8k.
Thanks for reading.
Twitter: @hedgopia
Author may hold a position in mentioned securities at the time of publication. Any opinions expressed herein are solely those of the author, and do not in any way represent the views or opinions of any other person or entity.


