The following is a recap of the May 13 COT Report (Commitment Of Traders) released by the CFTC (Commodity Futures Trading Commission) looking at COT data and futures positions of non-commercial holdings as of May 10. Note that the change in COT report data is week-over-week. This blog post originally appeared on Hedgopia – Paban’s blog.
COMMODITIES
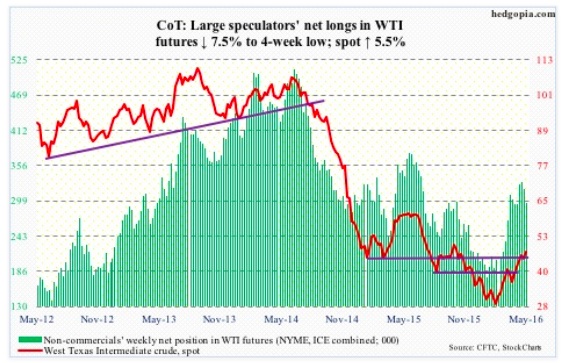
Crude oil: Global oil markets are heading towards an equilibrium, says the International Energy Agency.
OPEC is not seeing a decline in oil production, non-OPEC is.
OPEC member Iran’s crude oil production apparently jumped to 3.6 million barrels per day, back to pre-2012 sanction levels. And it is seeking to win back market share. On Tuesday, it cut crude prices versus Saudi Arabia and Iraq, setting the June official selling price for Iranian heavy crude at $1.60 a barrel below the Oman/Dubai average.
At least in the U.S., oil production is declining. For the week ended May 6th, production fell 23,000 b/d to 8.8 mb/d. This was the fifth consecutive sub-nine mb/d. Oil production peaked at 9.61 mb/d in the June 5th week last year.
Help also came from crude oil imports, which dropped 5,000 b/d to 7.7 mb/d.
Stocks were down as well. For the first time in five weeks, crude inventory fell – by 3.4 million barrels to 540 million barrels. The preceding week’s total was a mere 1.8 million barrels from the all-time high 545.2 million barrels in October 1929.
Gasoline and distillate stocks fell as well – the former by 1.2 million barrels to 240.6 million barrels, and the latter by 1.6 million barrels to 155.3 million barrels.
The only downer was refinery utilization which fell six-tenths of a percentage point to 89.1 percent.
Spot West Texas Intermediate crude oil prices continued to rally – up 5.3 percent for the week. Kudos to oil bulls who for the third week running defended $43.50 support.
COT data: Currently net long 295k, down 24k.
Gold: Hedge fund titans Paul Singer, of Elliott Management, and Stan Druckenmiller, formerly of Duquesne Capital, versus Goldman Sachs. The former two are big believers in gold’s prospects as, in the words of Mr. Singer, “central bankers are completely focused on debasing their currencies.” The latter, in a May 10th note, expects gold prices ($1274/ounce) to reach $1,150 in a year, although it raised its forecast from prior $1,000.
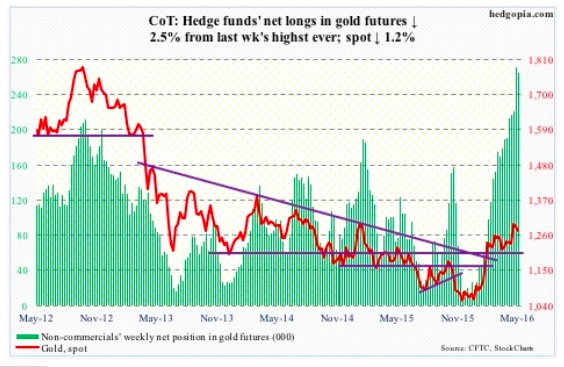
Whatever gold’s prospects – or a lack thereof – medium- to long-term, the metal continues to be range-bound. Has been that way the past three months. In late April, it broke out of the range, and is struggling to save it.
It is worth remembering that gold demand surged 21 percent in 1Q16 – the fastest pace on record, according to the World Gold Council. GLD, the SPDR gold ETF, attracted $2.7 billion during the quarter. All this perhaps in anticipation of a convincing breakout, which is yet to occur.
At present, gold prices are bound by its 10-day moving average, which is beginning to roll over. Ditto with the 50-day moving average, which is slightly rising to flat. Time for gold bugs to step up to the plate.
COT data: Currently net long 264.9k, down 6.8k.
EQUITIES
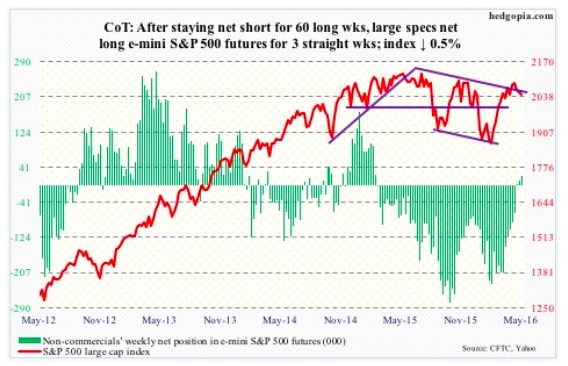
E-mini S&P 500: Last Friday, stock market bulls stepped up to defend the 50-day moving average, but were unable to hang on to the two-plus percent rally through Wednesday. Come Thursday, that average was tested again, with the session producing a spinning top. Friday, it was lost.
At least on SPY, the SPDR S&P 500 ETF, short interest increasingly is less of a tailwind. As of April 29th, short interest dropped 4.6 percent period-over-period to 237.9 million shares – the lowest since the end of March last year.
The ETF continued to see outflows, losing $9.5 billion in the nine sessions ended Tuesday. Then on Wednesday, it saw inflows of $3.2 billion. As a result, in the week ended Wednesday, flows were slightly positive – $77.6 million. That said, Wednesday was also a session the S&P 500 lost nearly a percent. A case of smart money leaving when the going is good?
In fact, Lipper data shows, another $6.1 billion left U.S.-based equity funds in the week ended Wednesday. This followed outflows of $11.2 billion in the prior week.
COT data: Currently net long 19.7k, up 9.6k.
Nasdaq 100 index (mini): To say that Apple (AAPL) is no longer the apple of investors’ eyes is probably not stretching it.
Over persistent concerns of slowdown in iPhone sales, it broke 92 this week. This support goes back to June 2014, or even September 2012. At 11.7 percent of QQQ, the PowerShares Nasdaq 100 ETF, AAPL still has outsize impact on the index. And it shows.
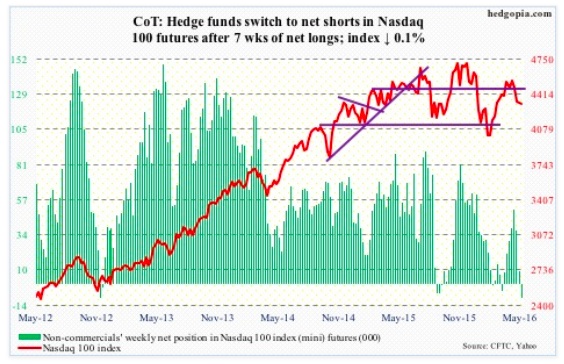
Early on this week, the Nasdaq 100 was able to build on last Friday’s intra-day reversal, and at one point was up 1.8 percent for the week. Wednesday’s rally attempt was vehemently denied by the 200-day moving average, with the 50-day right above. The session saw $483 million in inflows into QQQ, which is now underwater. For the week ended Wednesday, inflows were $447 million (courtesy of ETF.com).
As things stand, 4350 continues to be the line in the sand – rejected again on Friday.
COT data: Currently net short 9.3k, down 18.7k.
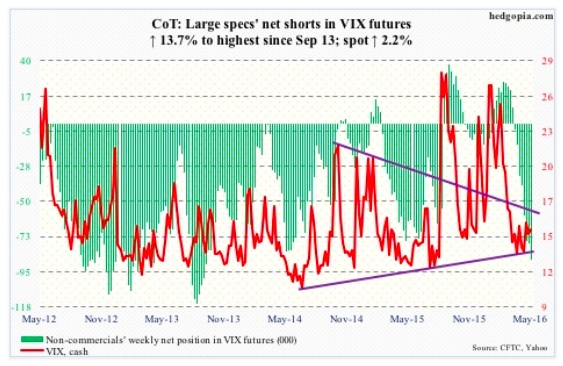
VIX: For nearly two months now, spot VIX Volatility Index has been hammering at resistance at 16-17, which goes back two decades. In the past, once this gets taken out, the VIX has shown a tendency to rally – rally good.
In this context, the longer end of the VXST (nine days)-VIX (30 days)-VXV (three months)-VXMT (six months) curve is steep, which probably suggests markets are bracing for higher volatility in the second half of the year (more on this here).
In this scenario, the VIX-to-VXV ratio is like a compressed spring, with four of the past nine weeks in 0.70s and three in low 0.80s.
COT data: Currently net short 88.1k, up 10.6k.
continue reading on the next page…

: Cup (and Maybe Handle) Watch")
 Reaches Important Price Support")

