After missing earnings in November, Cisco Systems (CSCO) has been putting in higher lows on the weekly chart. But investors may be right to use some caution here as it may be a simple retest of resistance.
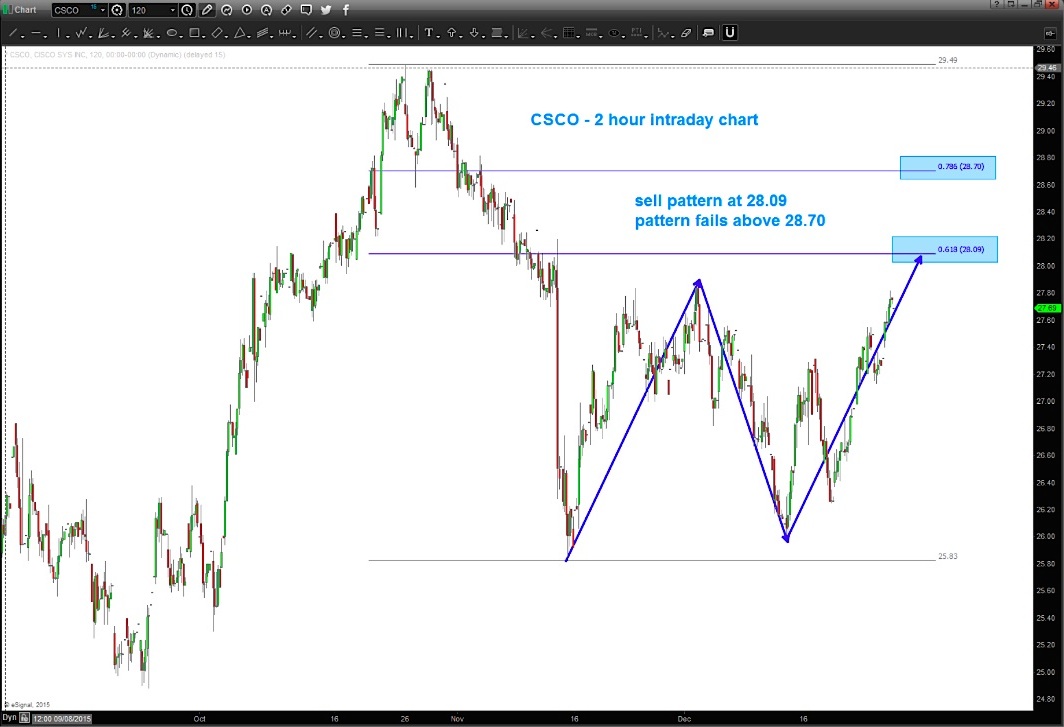
As well, Cisco Systems stock price is approaching a very important SELL PATTERN at 28.09.
That pattern could extend to the .786 Fibonacci retracement at 28.70, but first it will have to get through 28.09.
For those investors that understand patterns, or for that matter trade against support and resistance levels, you’ll appreciate this: For a bullish move higher to continue, this pattern needs to FAIL. If it does not fail, then Cisco’s stock price will more than likely target the low 20’s.
The best part about this is that I don’t have a horse in this race. I mostly trade FOREX but enjoy sharing meaningful patterns for equity traders as well. The best part about trading patterns is that it’s unemotional and it helps clearly define risk/reward (i.e. where we set our stops).
Cisco Systems Stock Chart (CSCO)
In the end, remember that these are just patterns. And they are meant to clearly define risk/reward – and that’s your edge. Thanks for reading.
Twitter: @BartsCharts
Author does not have a position in mentioned securities at the time of publication. Any opinions expressed herein are solely those of the author, and do not in any way represent the views or opinions of any other person or entity.


 Trading Into Inflection Point")


