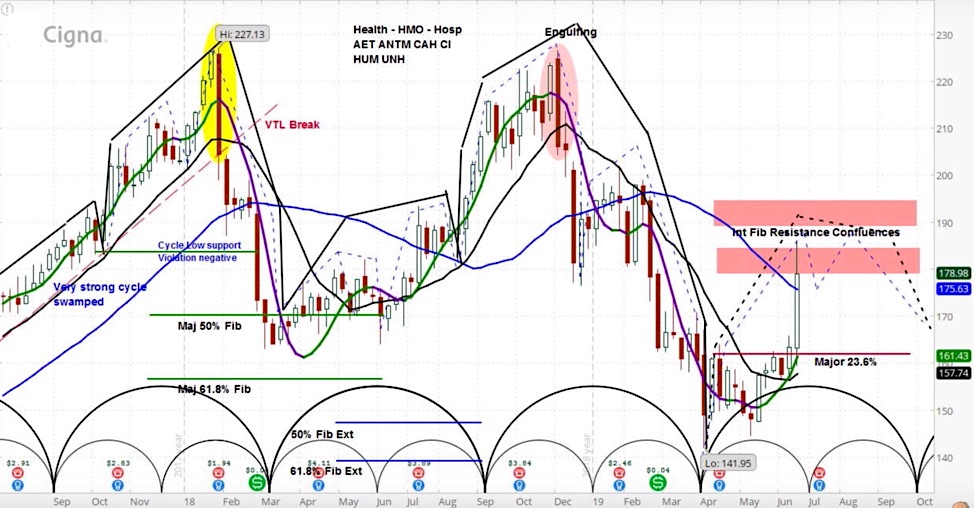
Cigna (NYSE: CI) Stock Weekly Chart
Today we take a look at an individual stock that moved significantly last week: Cigna (CI).
Cigna’s stock price rose by 9.6% to over $179. This occurred after the Trump administration let go of its plan to cancel rebates related to Medicare and Medicaid.
Based on its market cycles, CI is either still in the rising phase of its current minor cycle, or has already started the rising phase of its next minor cycle.
In either case, the stock is now in a Fibonacci resistance zone.
Having just made a new low in April, and showing weak technical patterns, we are not optimistic about the intermediate-term future of Cigna or the HMO group.
For a more detailed analysis of both of these charts, check out the latest episode of the askSlim Market Week show.
Twitter: @askslim
Any opinions expressed herein are solely those of the author, and do not in any way represent the views or opinions of any other person or entity.


