Global equity markets have come under heavy volatility this year, with leading markets like the US, China, and Europe declining swiftly.
China’s Hang Seng index in particular has sounded alarm bells, and we have been highlighting the importance of its bearish pattern for several months. Our latest research can be read here.
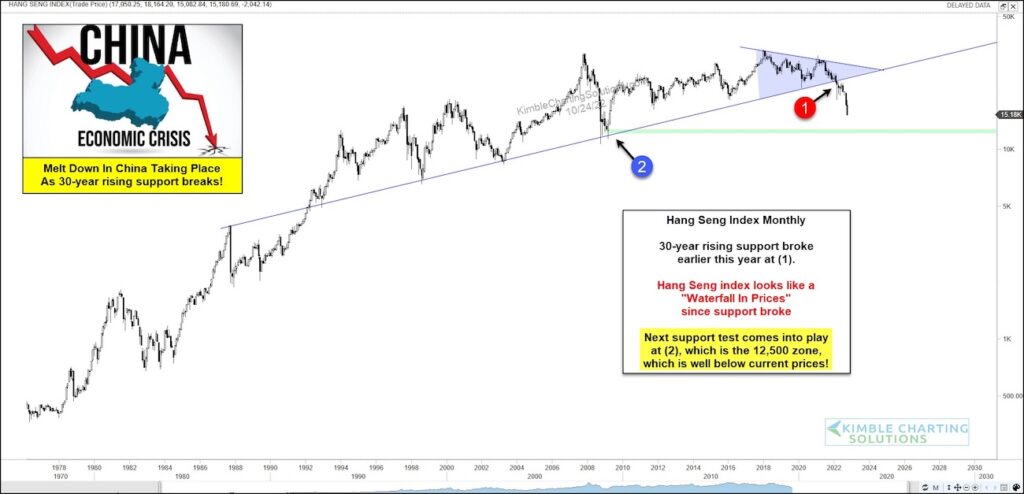
Today, we look at a “monthly” chart of the Hang Seng to provide an update.
As you can see, the Hang Seng index broke its 30-year trend line support at (1). This was when we first began warning investors of a deeper selloff.
Selling has accelerated since the breakdown in what appears to be a waterfall move. The next support comes into play at 12,500 which is well below current prices. This doesn’t bode well for Chinese stocks… nor the broader global equities market. In my humble opinion, investors should take note of this — it is worrisome that the largest country in the world in breaking down. Stay tuned!
Hang Seng Index Long-Term “monthly” Chart
Note that KimbleCharting is offering a 2 week Free trial to See It Market readers. Just send me an email to services@kimblechartingsolutions.com for details to get set up.
Twitter: @KimbleCharting
Any opinions expressed herein are solely those of the author, and do not in any way represent the views or opinions of any other person or entity.
: Creating Bullish Divergence?")


: Creating Bullish Divergence?")