Back in 2015, the China ETF (NYSEARCA:FXI) was in free-fall. Investors were wondering when the China stock crash would end and if it would spread to other markets.
Well, thankfully it did end. And during that period of free-fall, it left an unfilled open gap on its price chart. And that gap may prove to be a bullish price target, if the developing stock price pattern for FXI has any say in the matter!
The chart below takes a look at the China ETF (FXI) on a weekly candle basis.
China ETF Stock Chart (FXI) – Weekly Bars
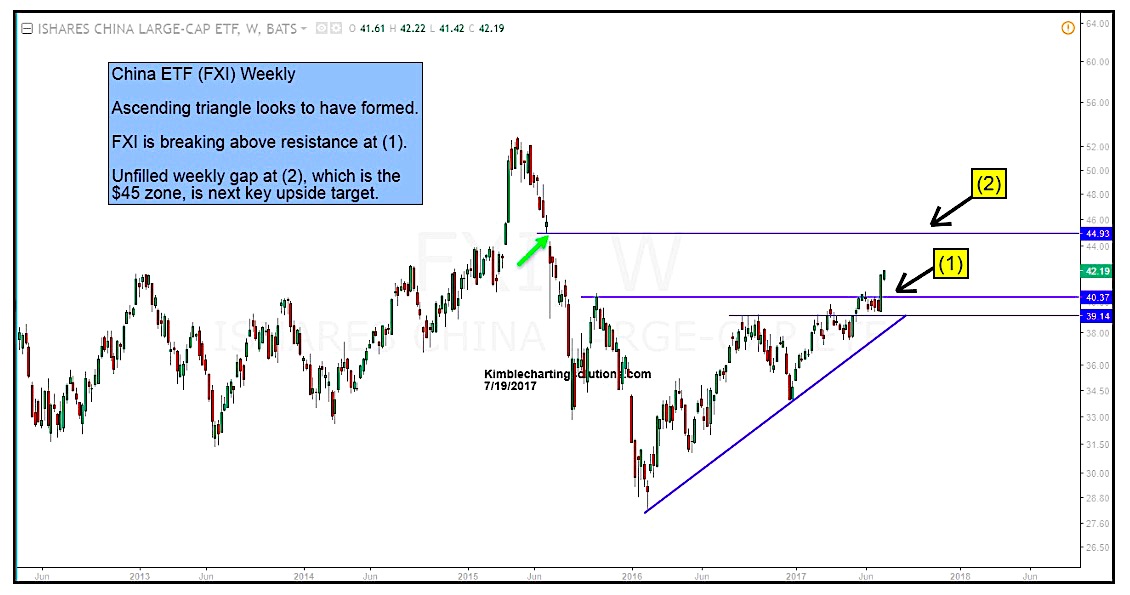
Over the past several months FXI has formed (and broken out of) an ascending triangle pattern (a bullish setup for traders). After a test old resistance (now support), a rally has taken shape and broken above key price resistance (see point 1).
As mentioned above, the China ETF has a large unfilled gap near the $45 price zone (see point 2). If the FXI rally continues to attract buyers, the open gap could act as a magnet and spur the rally higher yet. That could boost price 7-10 percent higher yet.
Thanks for reading.
Twitter: @KimbleCharting
Any opinions expressed herein are solely those of the author, and do not in any way represent the views or opinions of any other person or entity.


