 Here’s a small slice of those charts I’m looking at as another trading week wraps up.
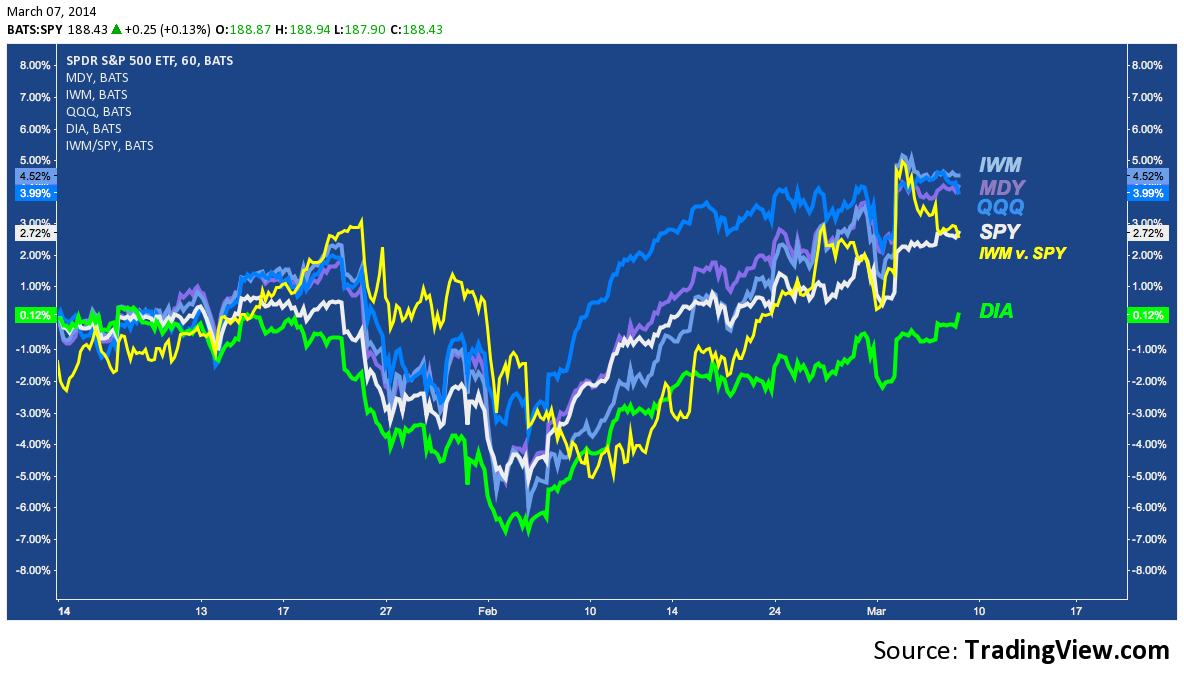
Market Cap Relative Strength
Relative strength across market capitalization remains “bottom-up” (i.e. market cap leadership is arrayed from small cap to mega cap), but the spike the Russell 2000 (IWM) saw with it’s huge pop on 03/04 (it’s biggest up day in almost 2 years) has largely dissipated. Though at all-time highs, the small cap leadership has failed for a second time this year to break out v. large caps (SPY). QQQ is an odd composite of the market caps more represented here: it has spent the latter part of this week under-performing them all.
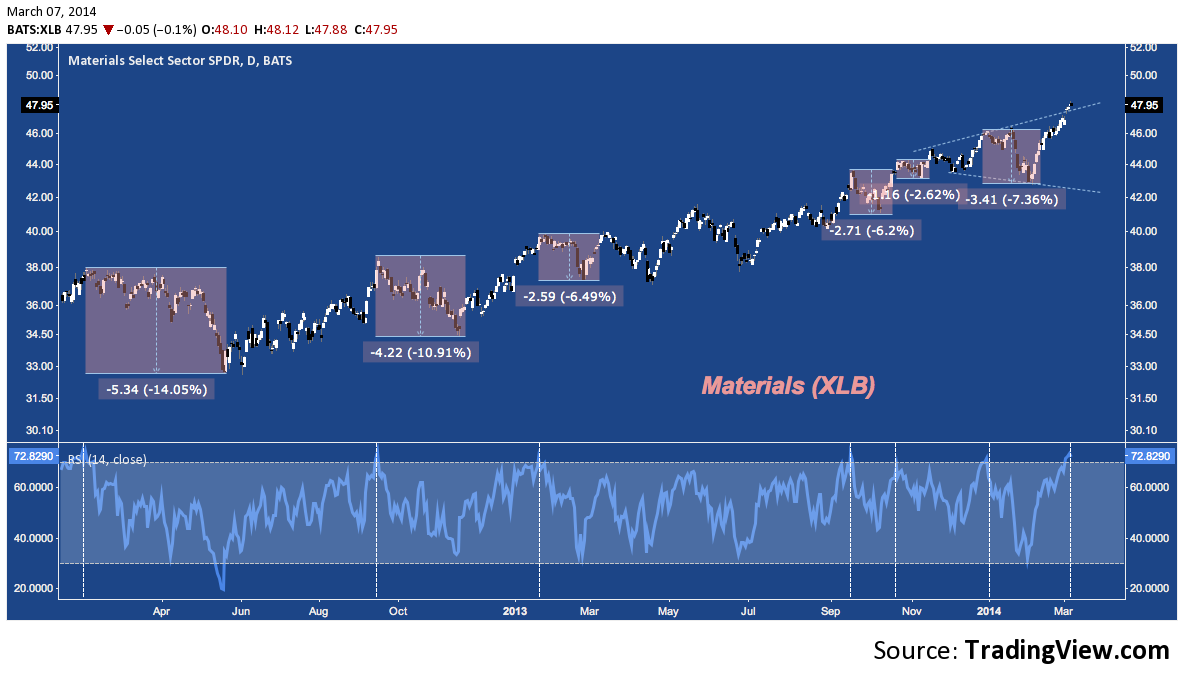
Materials (XLB)
Materials have outperformed markedly in Q1: as Factset reports, the sector has reported the highest earnings
growth rate in the S&P 500 at 24.6% with 98% of companies reporting. Now XLB is just above broadening formation resistance, but with an overbought RSI (lower panel) on its Daily chart. This momentum measure doesn’t necessarily indicate a local top, but it’s worthy of note that XLB has rolled over with virtually no further upside in the 6 previous occurrences (pullbacks averaging -7.94%) over the last 2 years.
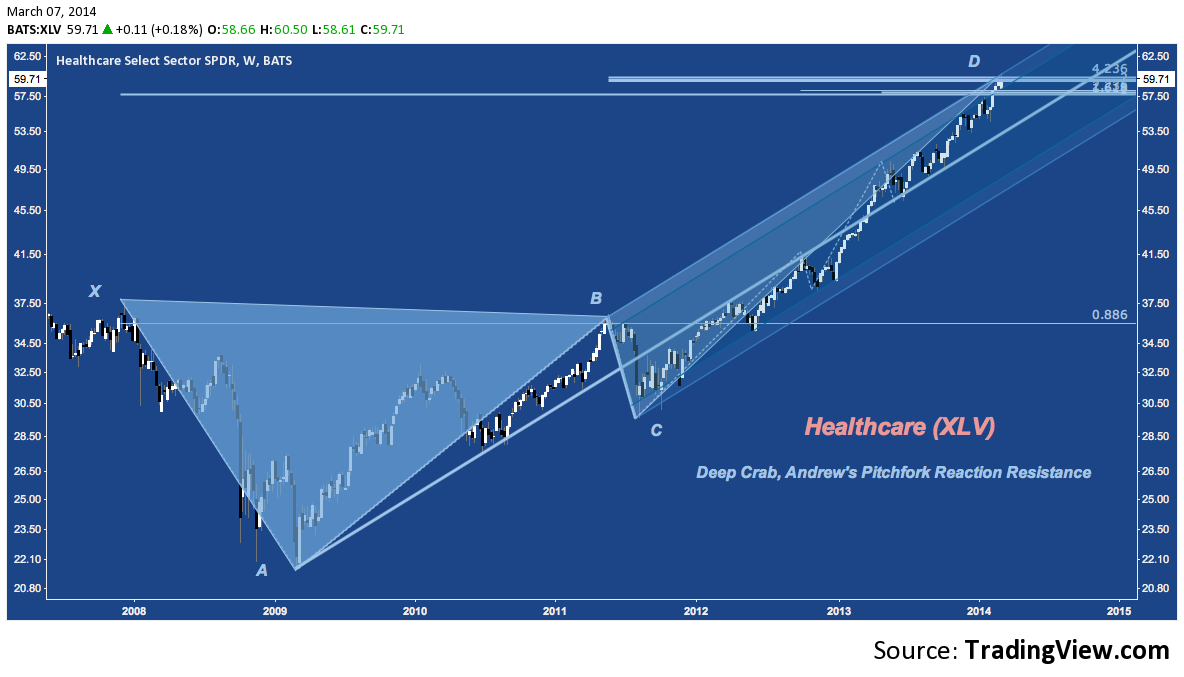
Healthcare (XLV)
Healthcare’s chart is a fascinating one. XLV destroyed its peers last year (only Consumer Discretionary kept pace) – largely on the back of the blistering upside pace set by Biotech – but is struggling to maintain forward momentum. It is in the potential reversal zone (PRZ) of a massive bearish Deep Crab harmonic pattern, and at the upper reactoon line of an Andrew’s Pitchfork spanning the entire 2009-2014 recovery. I think it’s highly likely XLV takes a breath here, with the nascent weakness seen in IBB a possible catalyst.
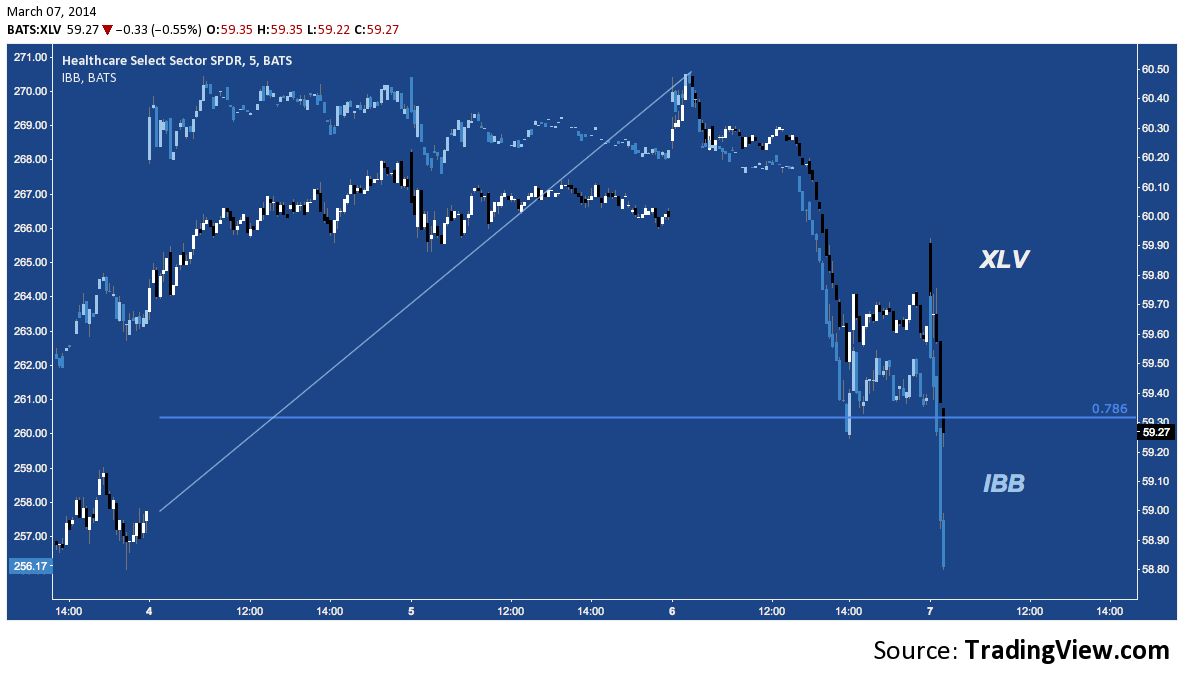
Healthcare (XLV) & Biotech (IBB)
Speaking of which: here’s an immediate-term look (5-minute chart) of IBB leading XLV down following the 03/04/14 spike.
There are dozens of interesting Biotech charts (many looking bubbly). Here are a few:
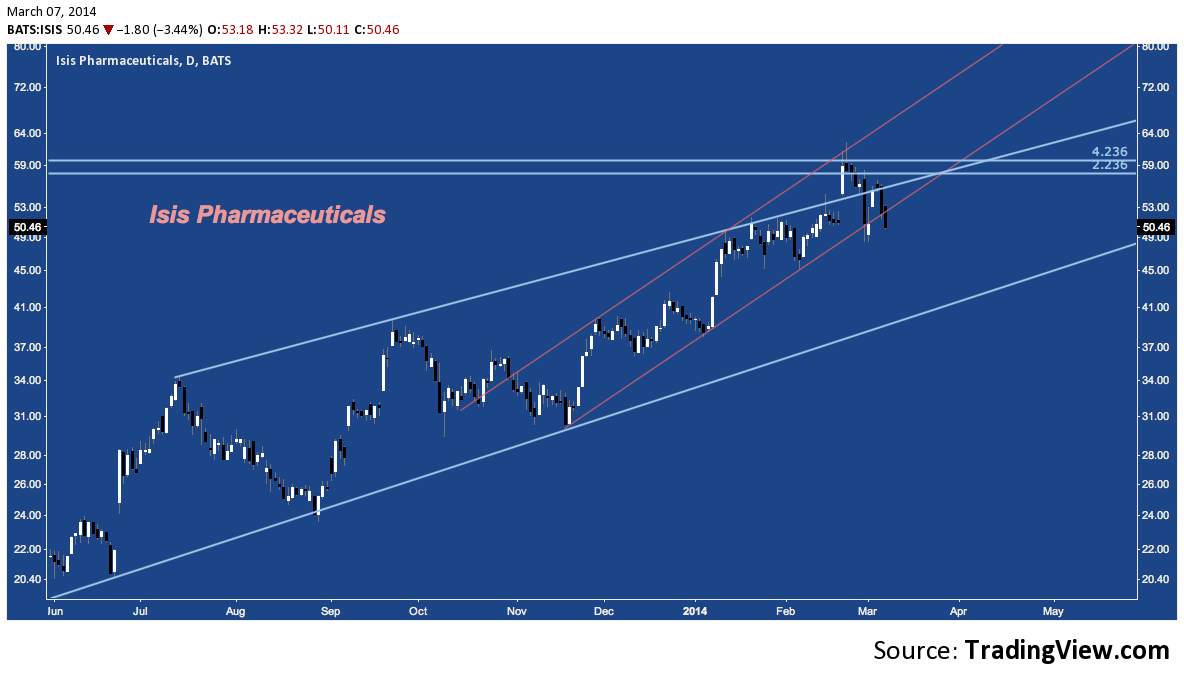
Isis Pharmaceuticals (ISIS)
Isis remains weak off of cluster resistance hit in mid-February. Unless it picks up late in today’s session, this will be the first close below it’s accelerated channel (orange) since it began in November. It’s medium-term channel (around since last Summer) saw a failed breakout last week that hasn’t been remedied since.
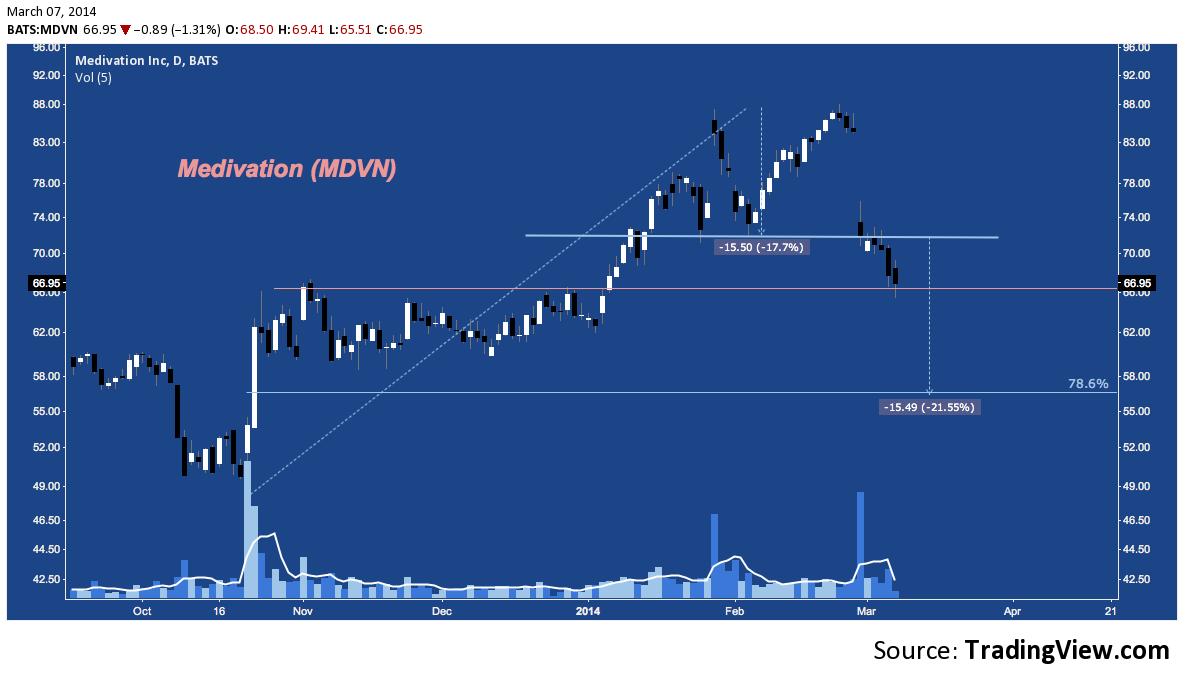
Medivation (MDVN)
Medivation looks like a double top on solid distribution. $66-$67 poses solid medium-term horizontal resistance-turned-support; and the October-December 2013 congestion between $58-$67 stands a very solid chance of arresting its decline. In any case if demand can’t break the reversal through that window, the double top target lies just below near $57.
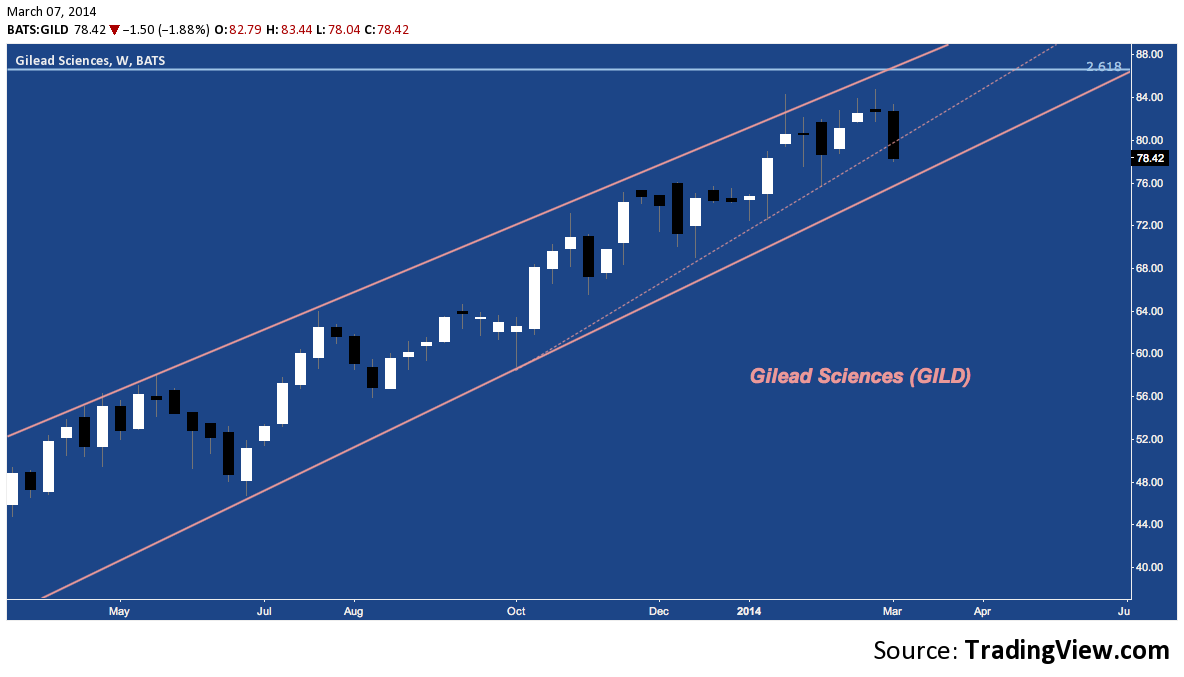
Gilead Sciences (GILD)
I’m told that among the Biotech giants, GILD is invulnerable. I’m purposefully ignorant of the narrative explaining why because all that noise is nicely baked in to Gilead’s chart; and that chart has a massive weekly down candle hanging over it like a pall following last week’s doji star. If GILD doesn’t rally from here, it breaks the accelerated channel underway since its early October hammer. It’s longer-run channel support lies just below near $76.
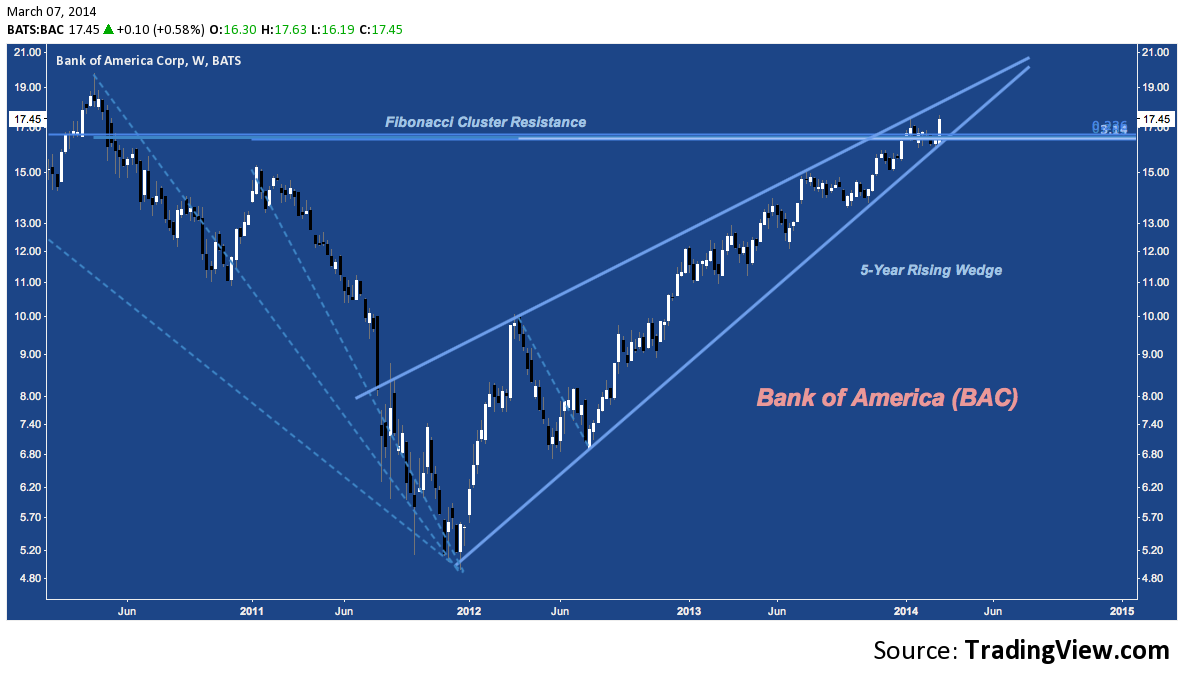
Bank of America (BAC)
Banks have steadily outperformed this week. As the largest constituent of the benchmark KBW Bank Index (BKX), Bank of America evokes that well, breaking sharply higher from a descending triangle since 2014 began. The stock remains in its 2-year rising wedge (forgive the typo), however. Just a few pennies above January’s high, BAC‘s performance is impressive, but I’m not yet convinced it will get away from the cluster resistance noted so easily.
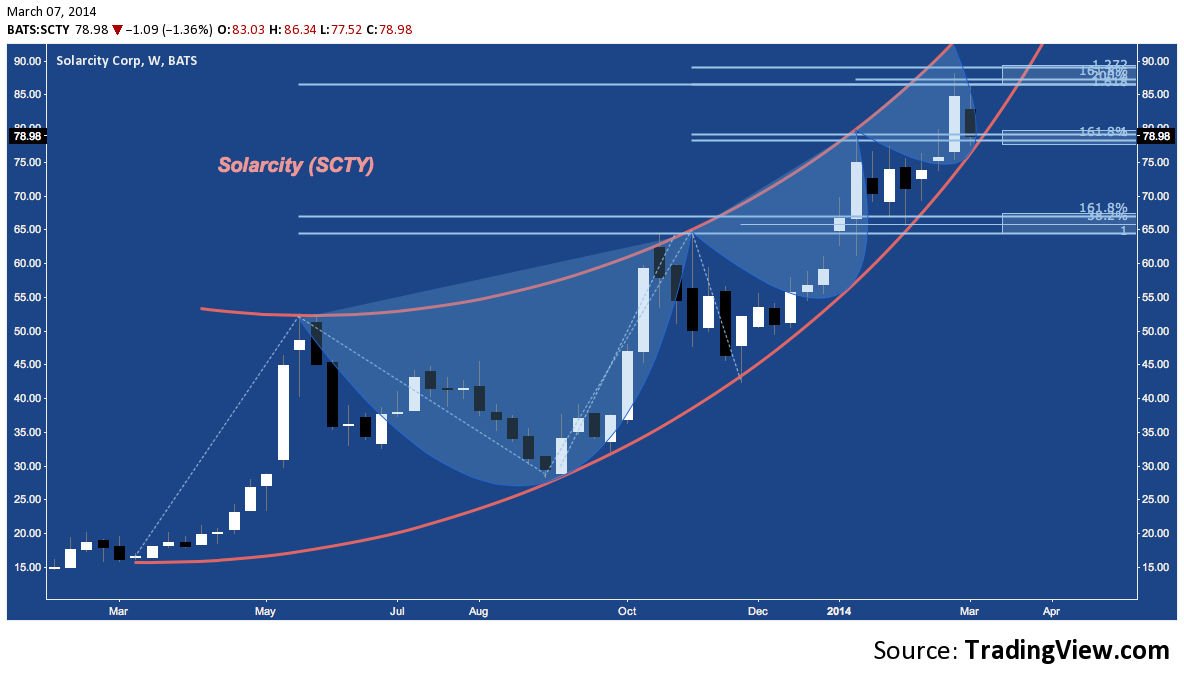
Solarcity (SCTY)
Solarcity’s arc higher is an impressive study in market symmetry. It’s adherence to its fibonacci clusters (i.e. the groups of horizontal blue lines) is equally remarkable. Is it abiding by the numeric logic of the universe; or are these lines a self-fulfilling prophecy? Theoreticians will take sides: but it doesn’t matter: SCTY bounced off cluster resistance last week, retested it this week, entered a lower high and is back to support over 10% lower.
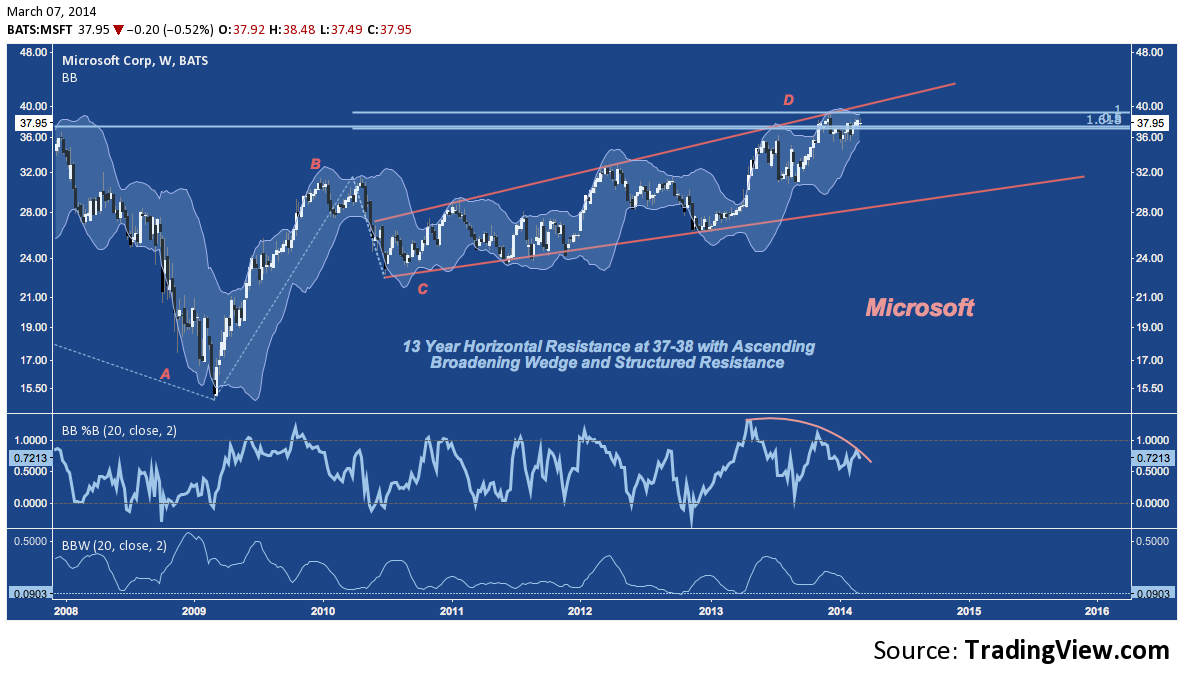
Microsoft (MSFT)
Bill Gates seems to have regained his position as richest man in the known universe; but it’s unlikely Microsoft stock is responsible. MSFT remains at horizontal resistance, structured resistance and broadening wedge resistance on negatively diverging momentum (middle panel) and Bollinger Bands that are as tapered as they’ve been in years. Prepare for higher volatility just ahead: for now, the path of least resistance looks south.
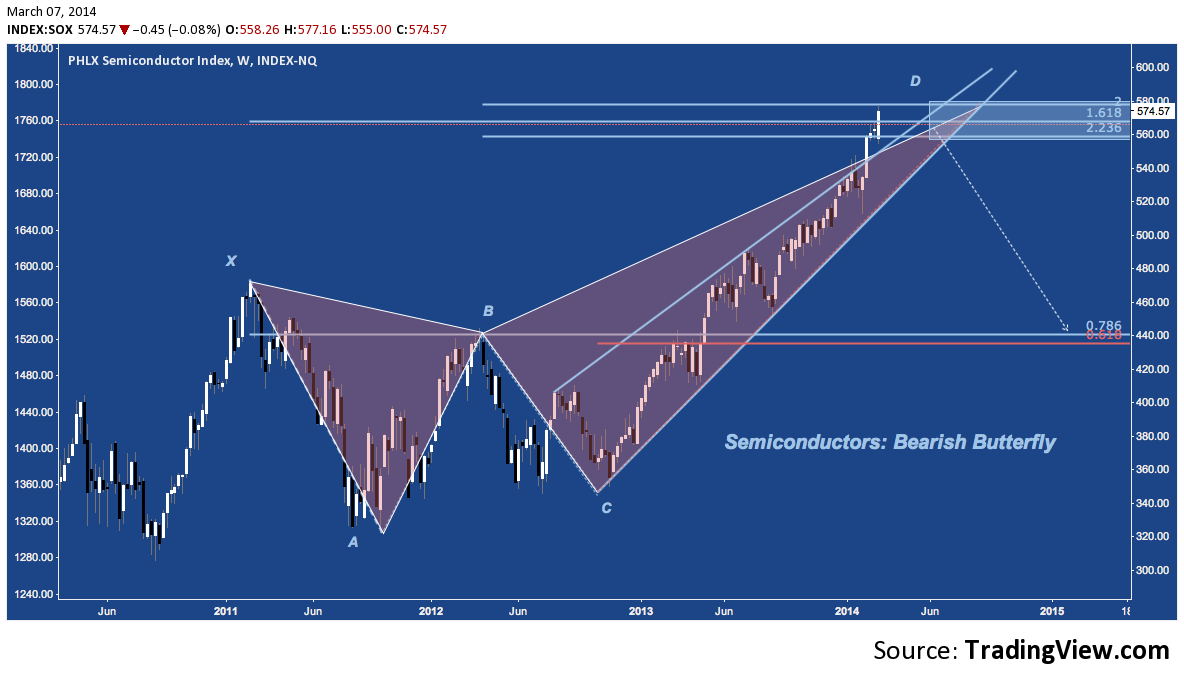
Semiconductor Index (SOX)
Like banks, Semis were the beneficiaries of fresh inflows this week, with SOX breaking higher into the Bearish Butterfly harmonic pattern PRZ between 560-580. Near the upper reaches of the reversal zone, this pattern provides a highly asymmetric risk profile: risking 10 points (i.e. a stop at 585, or the SMH analog) for a downside pattern object to ~440.
And Turning briefly to Forex….
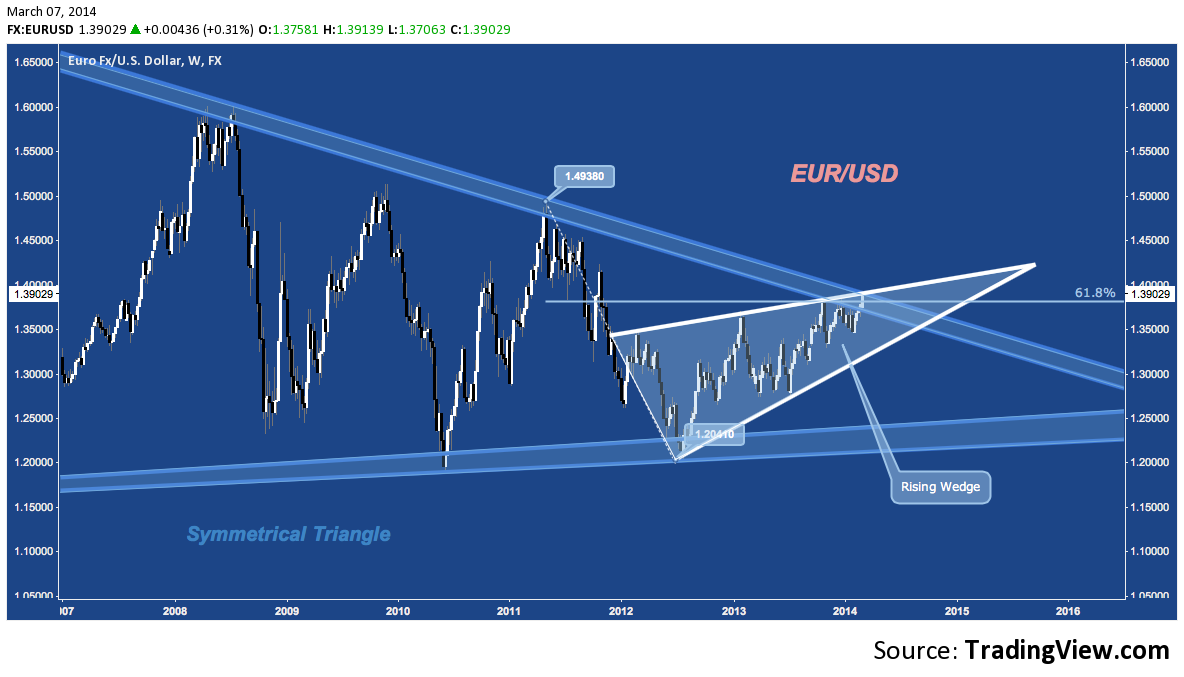
EUR/USD
EUR/USD is at major multi-year resistance. Breaking it down, the benchmark currency pair is at 2-year rising wedge trend line resistance, multi-year symmetrical triangle resistance, and just above the 61.8% fibonacci retracement of its 2011-2012 range. A breakout over 1.40 opens the way toward 1.45 (not mid-2011’s congestion); but consider the massive drops EUR/USD has proven itself capable of after aggressive up-trends. By all appearances, the ECB has decisively backed off of the prospect of further cutting and QE for now, spurring this week’s strength; but if the pair is likely to take a turn in the Greenback’s favor, it is likely to be close by.
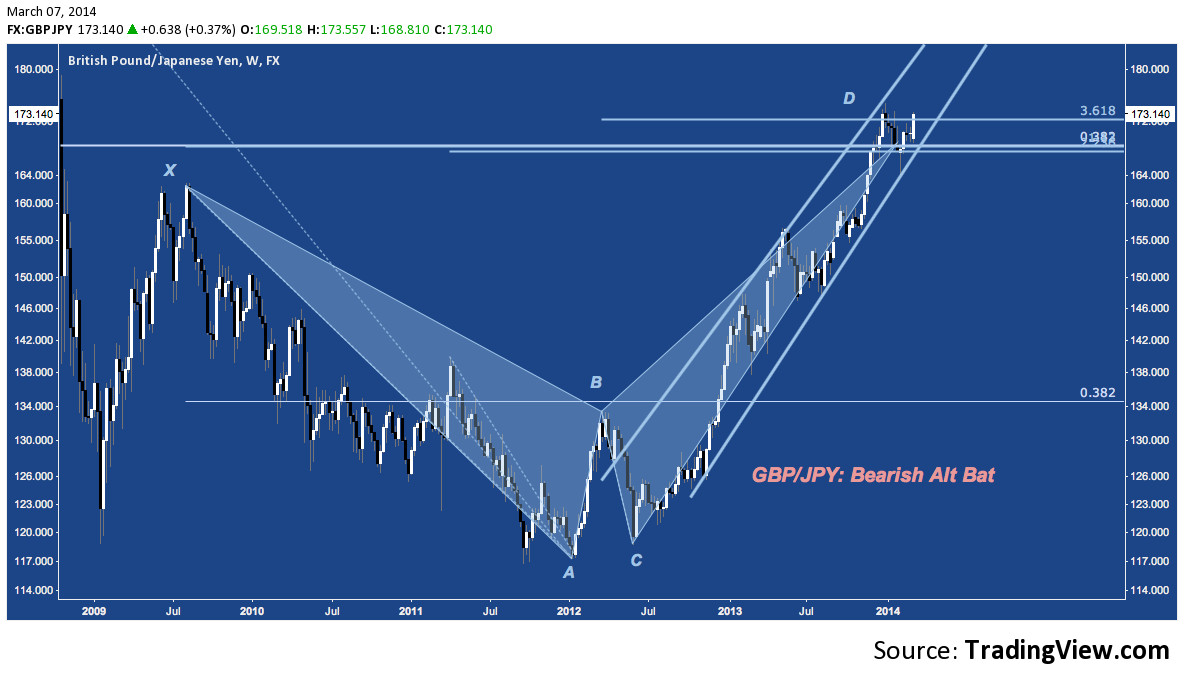
GBP/JPY
The British Pound/Japanese Yen cross is retesting it’s 10-week congestion zone at 170-173. This level coincides with the PRZ of a 5-year Bearish Alt Bat harmonic pattern.
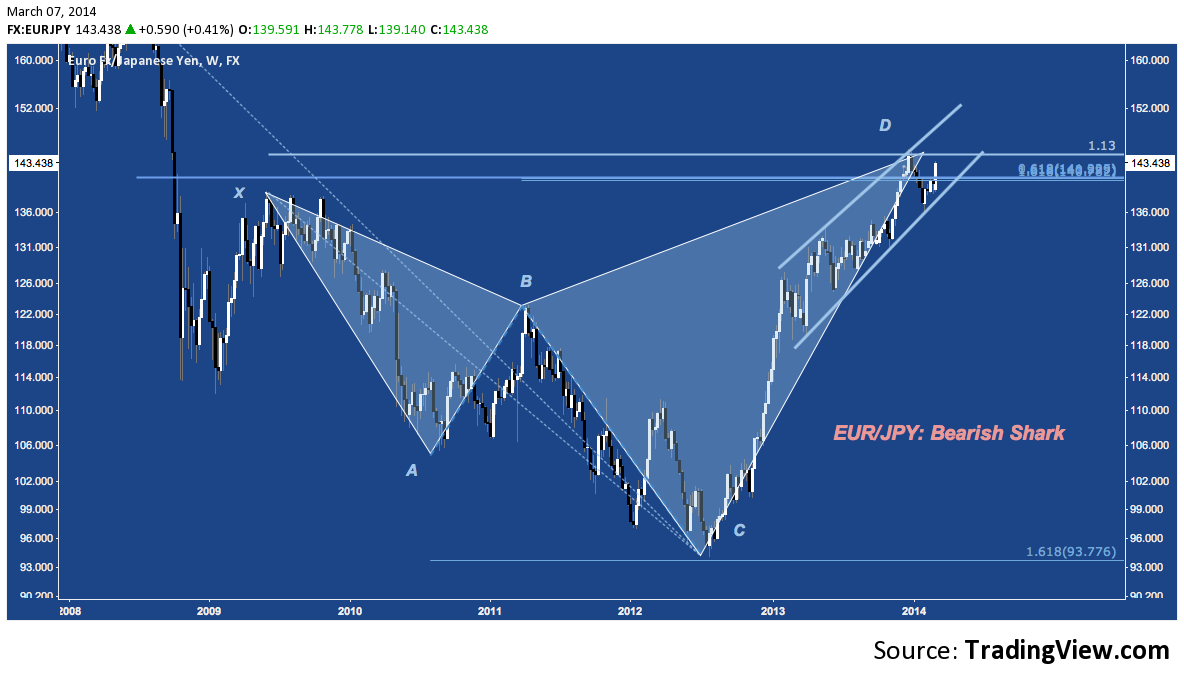
EUR/JPY
The Euro/Japanese Yen cross is generally tracking GBP/JPY, characterized instead by a Bearish Shark harmonic pattern with a PRZ near 141-144.
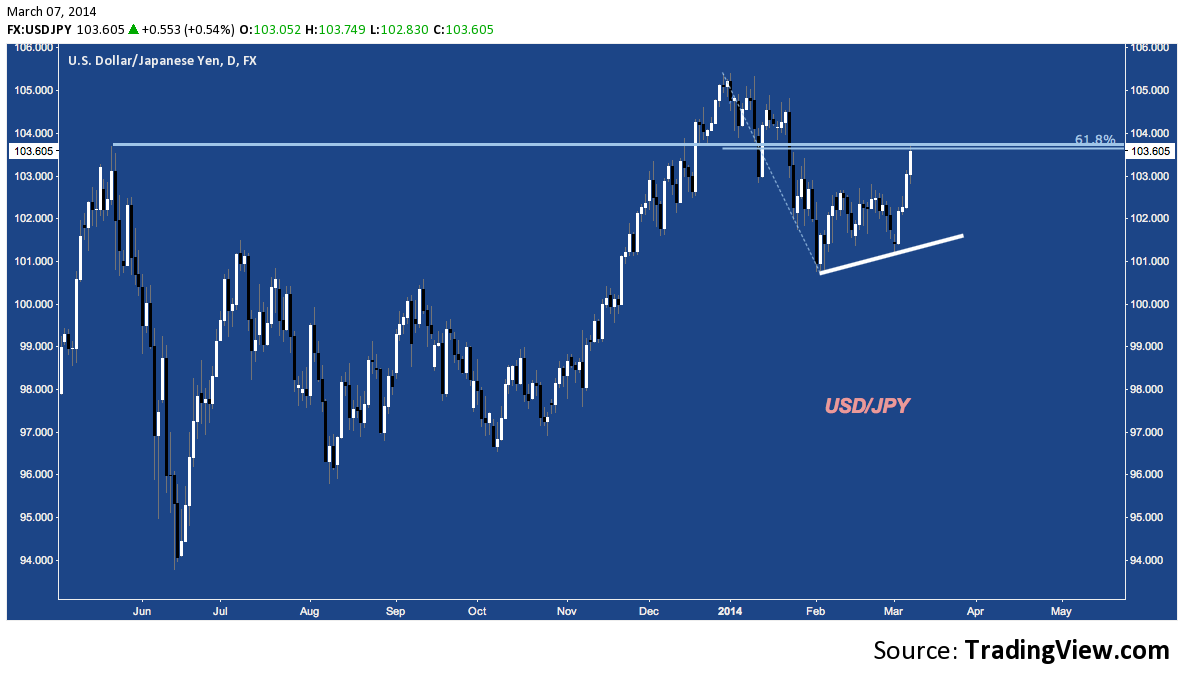
USD/JPY
The US Dollar/Japanese Yen cross broke back into and then above ascending triangle resistance near 102.70. Now it’s faced again with resistance at May 2013’s high just below 104, occurring at the 61.8% retracement of the Dec 2013-Feb 2014 range.
Twitter: @andrewunknown and @seeitmarket
Author carries net short exposure to Russell 2000 at time of publication. Commentary provided is for educational purposes only and in no way constitutes trading or investment advice.
Charts courtesy of TradingView.com
Any opinions expressed herein are solely those of the author, and do not in any way represent the views or opinions of any other person or entity.
: Worrisome to Broader Market?")

: Important Breakout Retest")
