Like equity markets, foreign exchange is replete with major patterns poised to break out or break down in the near-term. Here’s a wide-ranging, multi time frame glance at a selection of these patterns, beginning with a sub-set of forex pairs broadly watched as a barometer of risk appetite: the Yen Crosses.
Japanese Yen Crosses
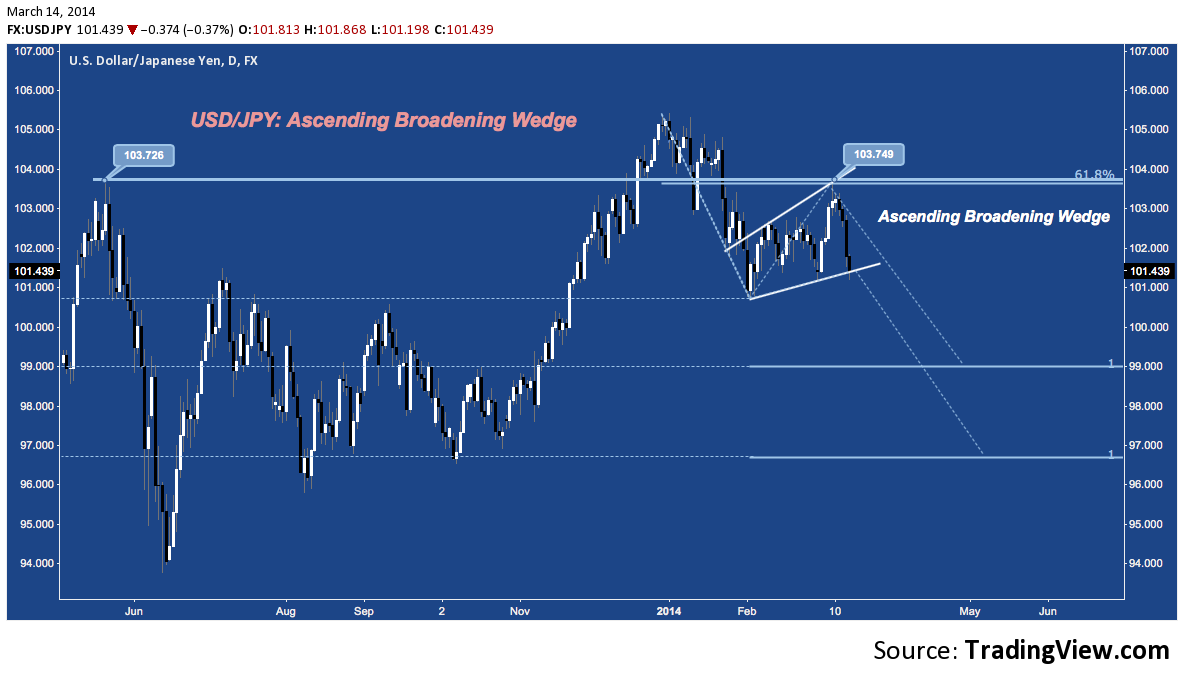
USD/JPY – Daily: Ascending Broadening Wedge
In correlation with the Japanese Nikkei, USD/JPY declined steeply in January from it’s late 2013 high above 105 to 100.76. The pair bottomed with stocks indices (e.g. DAX, SPX) in early February; but instead of rallying furiously instead ambled sideways until early March, creating an Ascending Broadening Wedge. Following failure of the attempt then to retake May 2013’s high at 103.72 (almost to the pip), USD/JPY has slid aggressively from confluence of wedge resistance and 103.75 to wedge support at 101.40. A break below this level almost immediately early February’s 100.75 support. Below there, measured move objectives come in at 99 and 96.60.
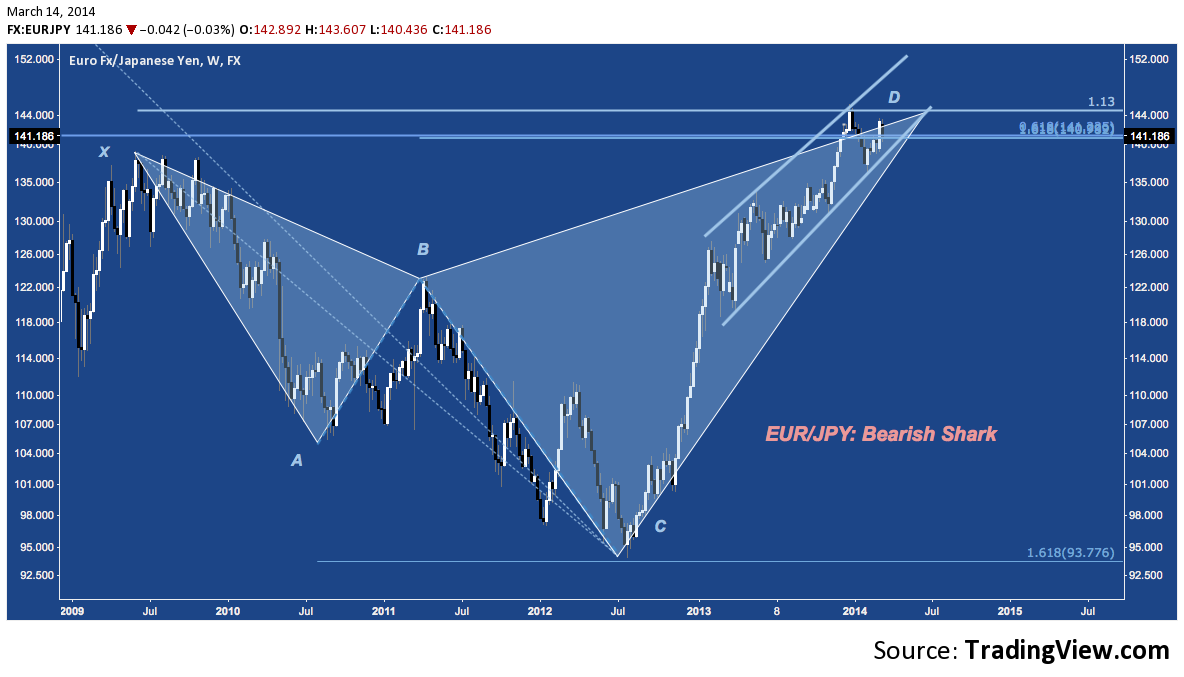
EUR/JPY – Weekly: Bearish Shark
EUR/JPY remains above 2009’s high at 138, working through consolidation at its 5-year Bearish Shark PRZ (at D). If this level resolve into a reversal below 2013-2014’s rising channel support at 140, support rungs fall at 136.50, 131, 127 and finally at B in the low 120s.
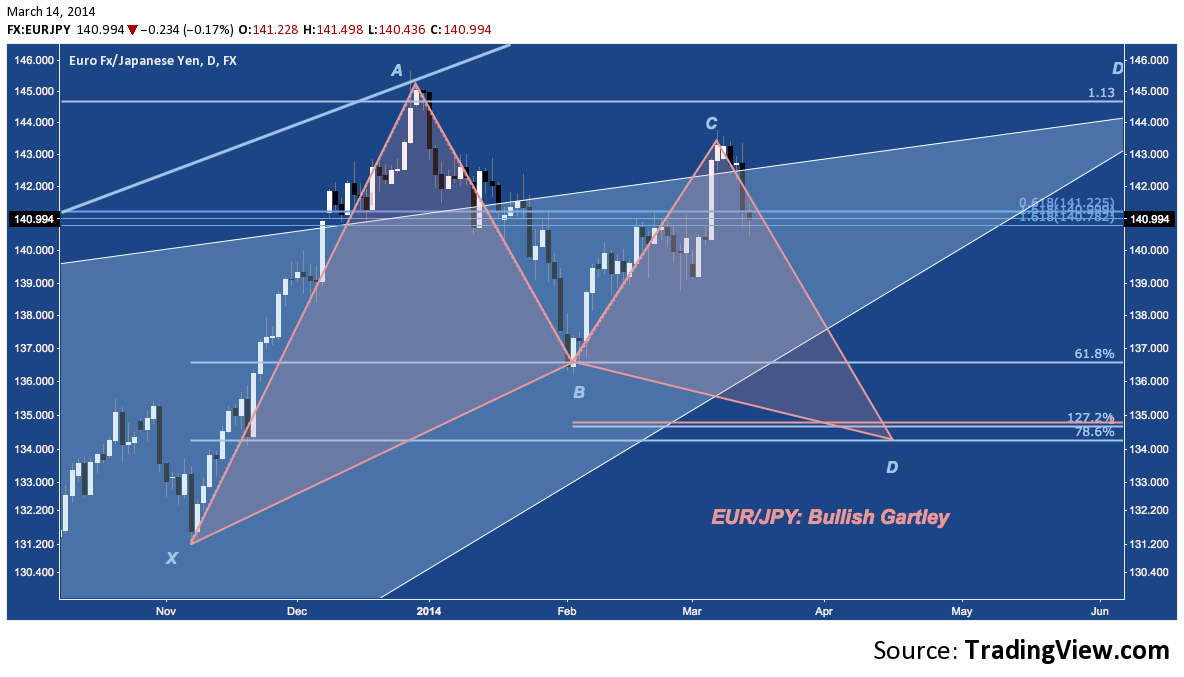
EUR/JPY – Daily: Bullish Gartley
What would a break below 140 look like? EUR/JPY has built out a Bullish Gartley over the last 4.5 months. Completion of the pattern entails a break below 139 horizontal support and 136.50 (point B), with the Gartley PRZ at 134-135.
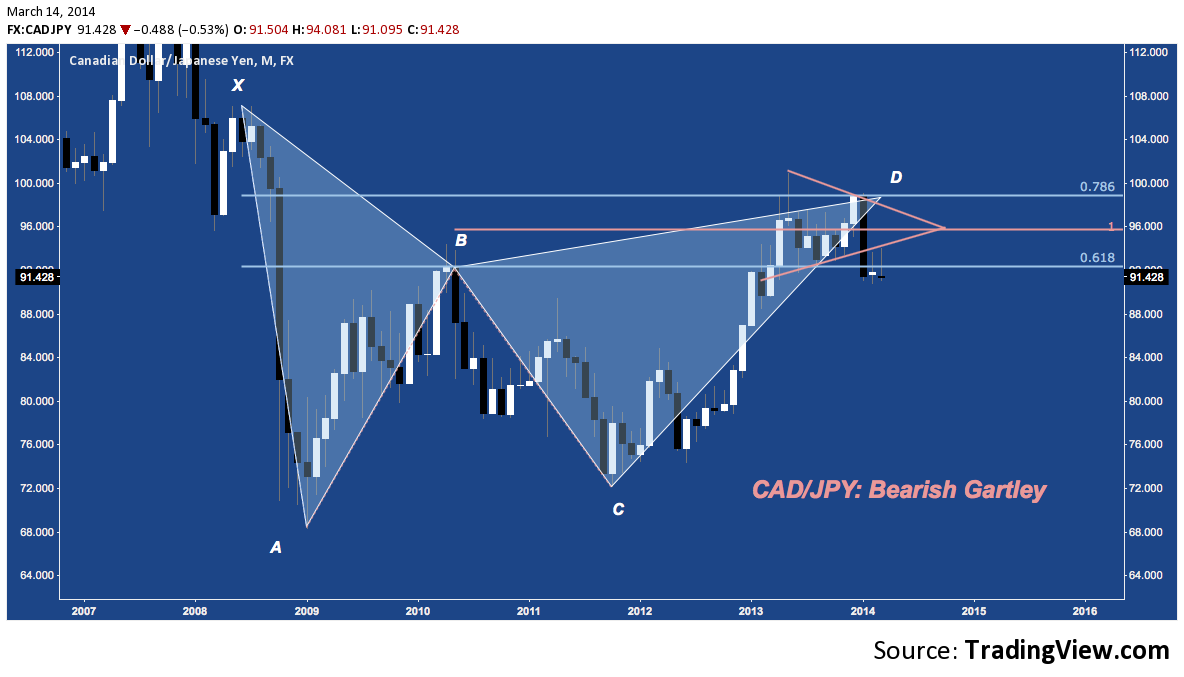
CAD/JPY – Monthly: Bearish Gartley
CAD’s general weakness has resulted in it’s broad under performance v. other DM currencies, with JPY being no exception. Completing a Bearish Gartley in early 2013, the pair entered an 800-pip consolidation, giving 100 a second (failed) attempt in December. After it’s rejection there, CAD/JPY fell sharply in January (it’s worst month since late 2008), breaking 2013’s symmetrical triangle. February and March were marked by attempts to regain point B, with both failing as well. The next major support rung lower falls at 88, with 2011’s swing high further down near 85.
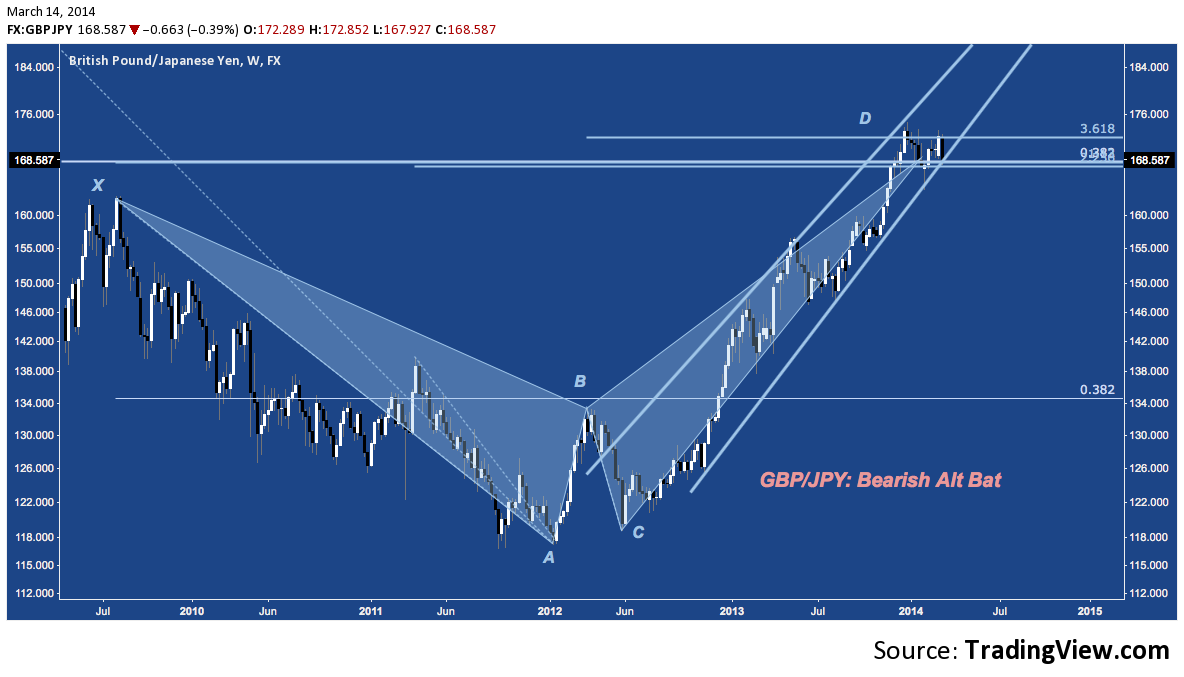
GBP/JPY – Weekly: Bearish Alt Bat
Guppy, like EUR/JPY, is hanging out in a narrow multi-month consolidation above 2009’s high at its Bearish Alt Bat between 168-173. The level to watch here at point D is 168: a break down through here snaps February’s low, and rising 15-month rising channel support.
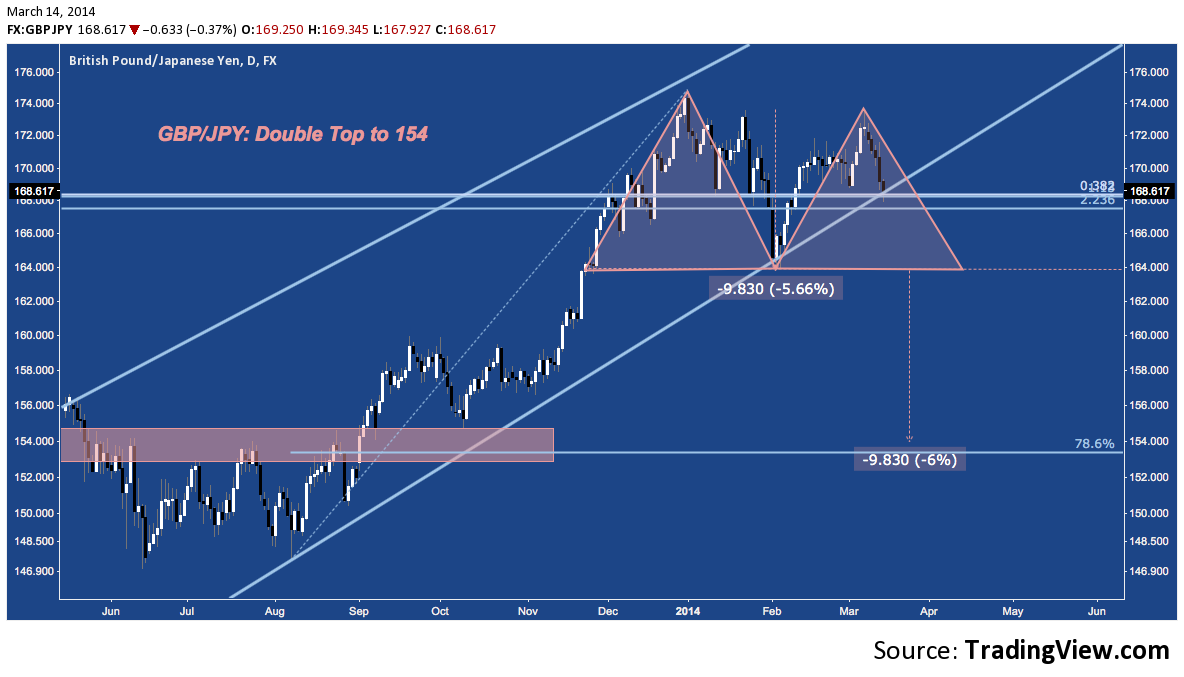
GBP/JPY – Daily: Double Top
A Channel/PRZ break at 168 looks for support at 164. Below here, a double top activates, projecting a measured move target 6% lower to 154: this level coincides with congestion resistance GBP/JPY spent an extended period with in Q2-Q3 2013.
US Dollar Crosses
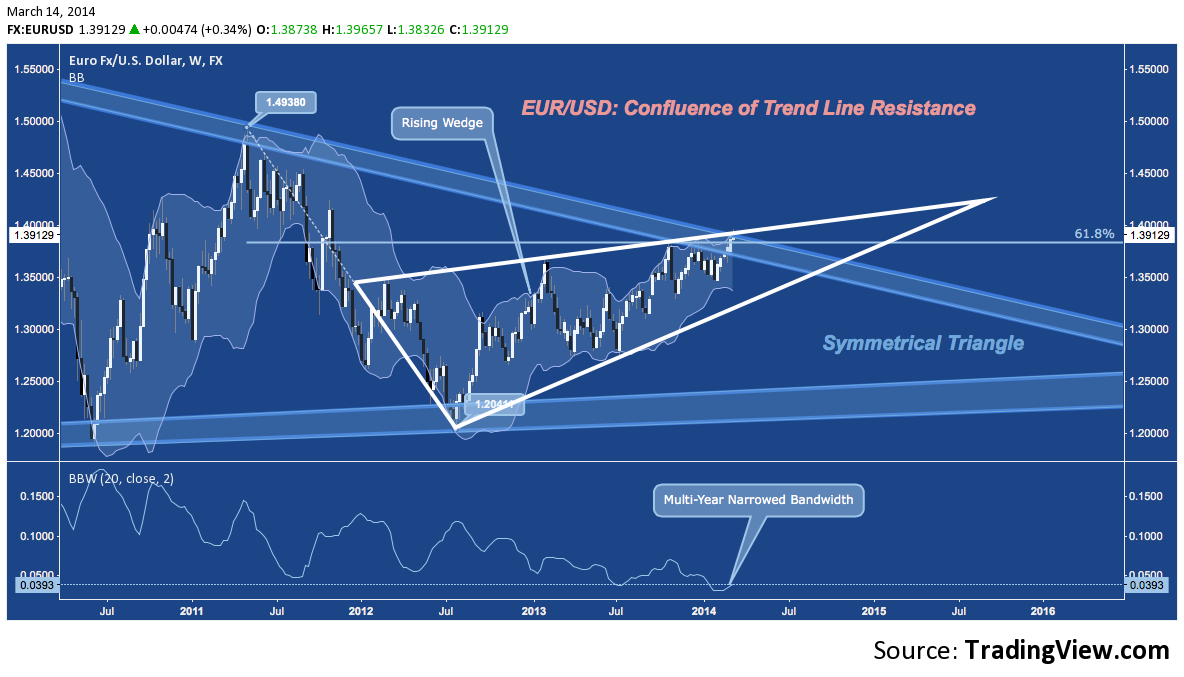
EUR/USD – Weekly: Symmetrical Triangle, Rising Channel
EUR/USD continues to test higher against its confluence of 1) the 61.8% retracement of its 2011-2012 range, 2) rising wedge and 3) symmetrical triangle trend line resistance. In the bottom panel below, note Bollinger Band Bandwidth is hovering near a multi-year low: this indicates EUR/USD’s BBs are very narrow: a condition that presages a significant increase in volatility. A major breakout above 1.40 or rejection lower from 139 is building.
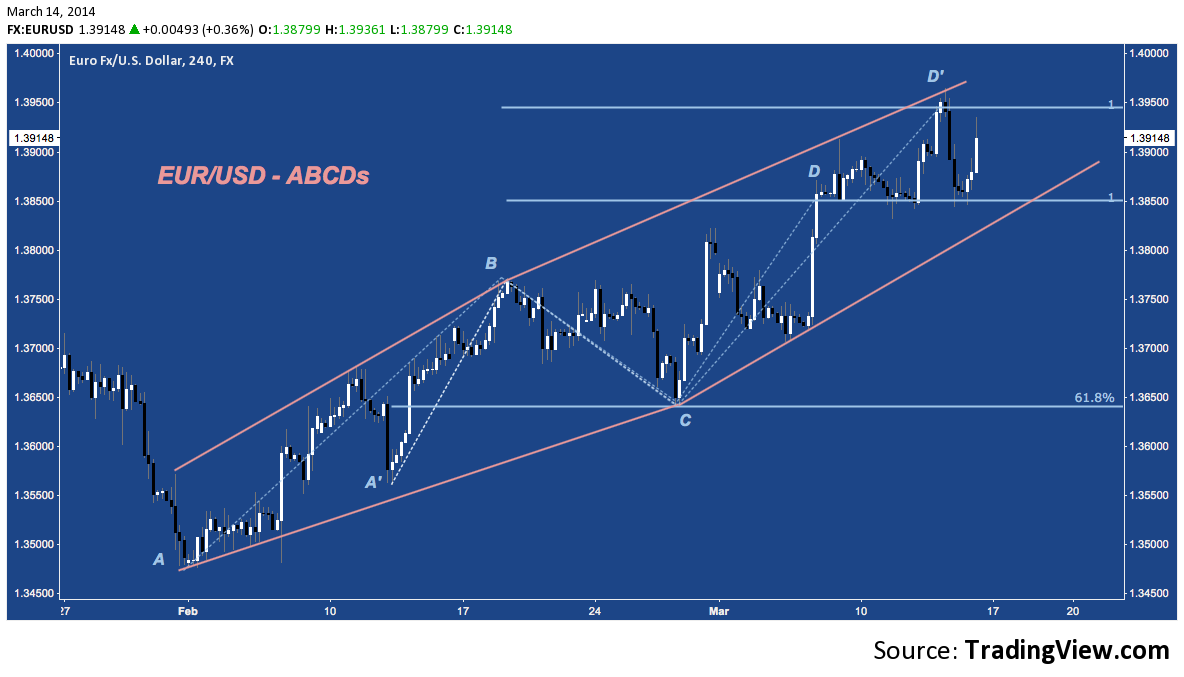
EUR/USD – 4-Hour: ABCDs
Looking out over the last 6 weeks, the advance from 1.3470 to test this confluence at 139 is been characterized by two ABCD patterns, both of which tagged their measured move targets this week. Accomplishing these moves may now invite supply into the Euro.
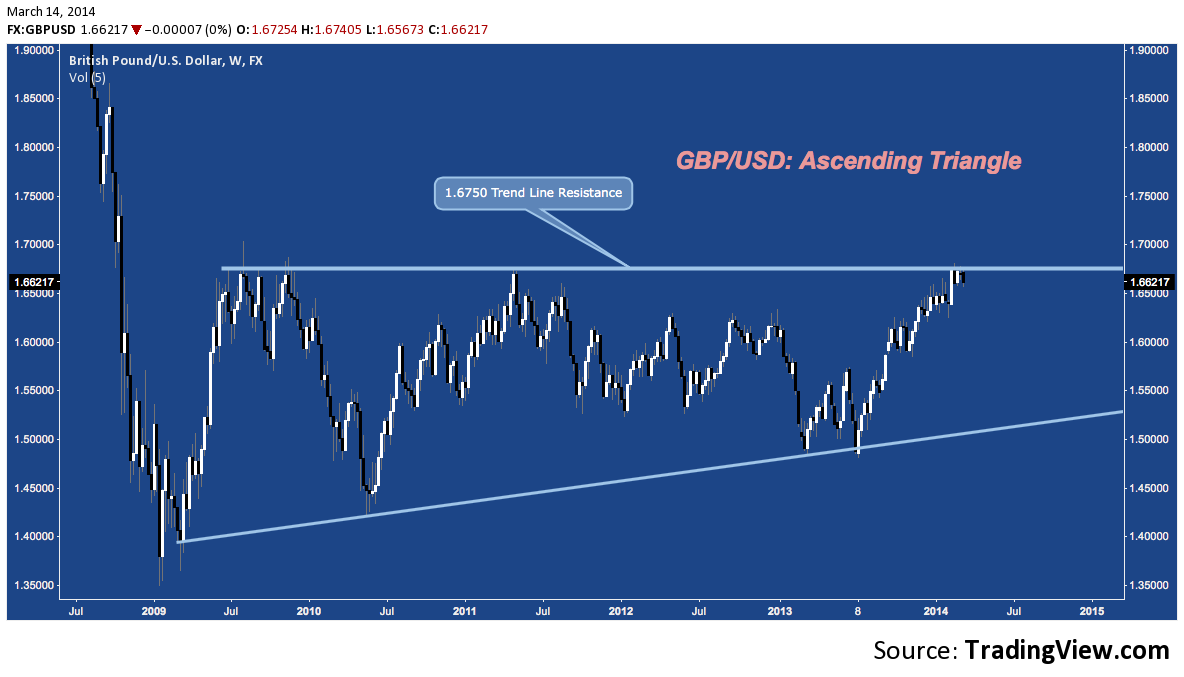
GBP/USD – Weekly: Ascending Triangle
Since late Summer, Cable has been a a tear with Pound Sterling appreciate well over 10% v. the US Dollar. Since early February, the pair has struggled to achieve further upside against a familiar level: 2009 and 2011 resistance at 1.6750.
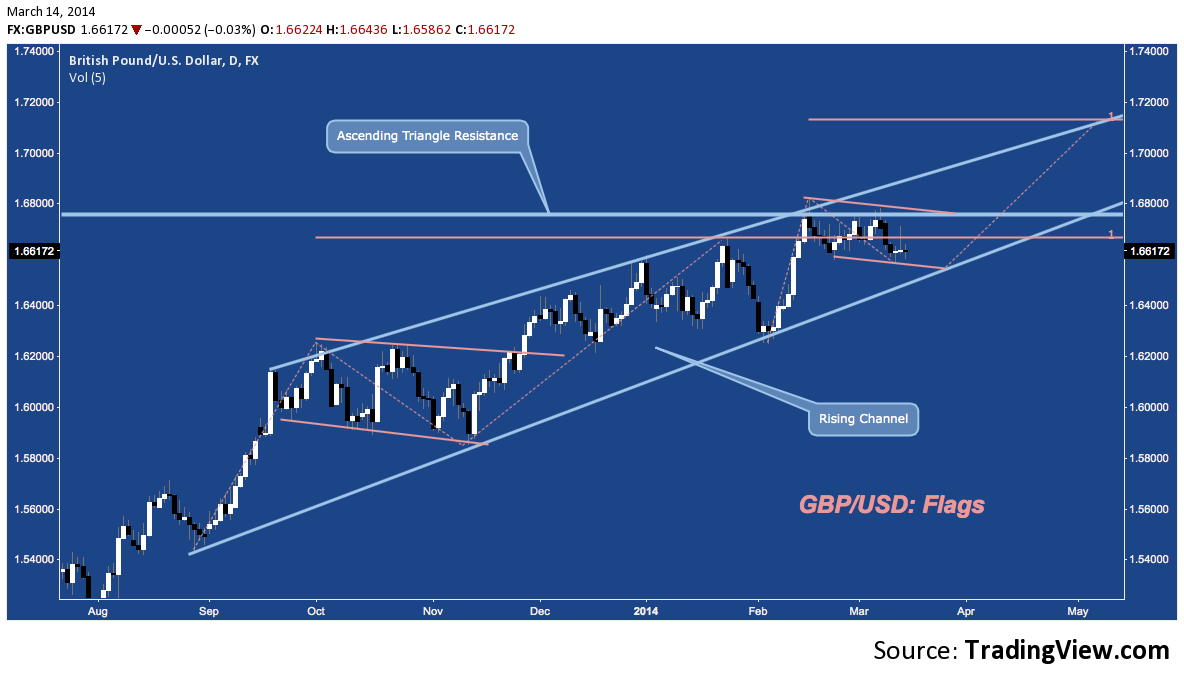
GBP/USD – Daily: (Bull) Flags
Looking closely at this resistance level, we see the 6-week congestion is a choppy flag consolidating the 550-pip rally from early February. This setup – similar to the August 2013-January 2014 measured move before it – stands to break 1.6750 and moving as high as 1.7150 before tagging rising channel resistance. Support lies at in the flag and channel support at 1.65. On a break, 1.6250 horizontal support falls next.
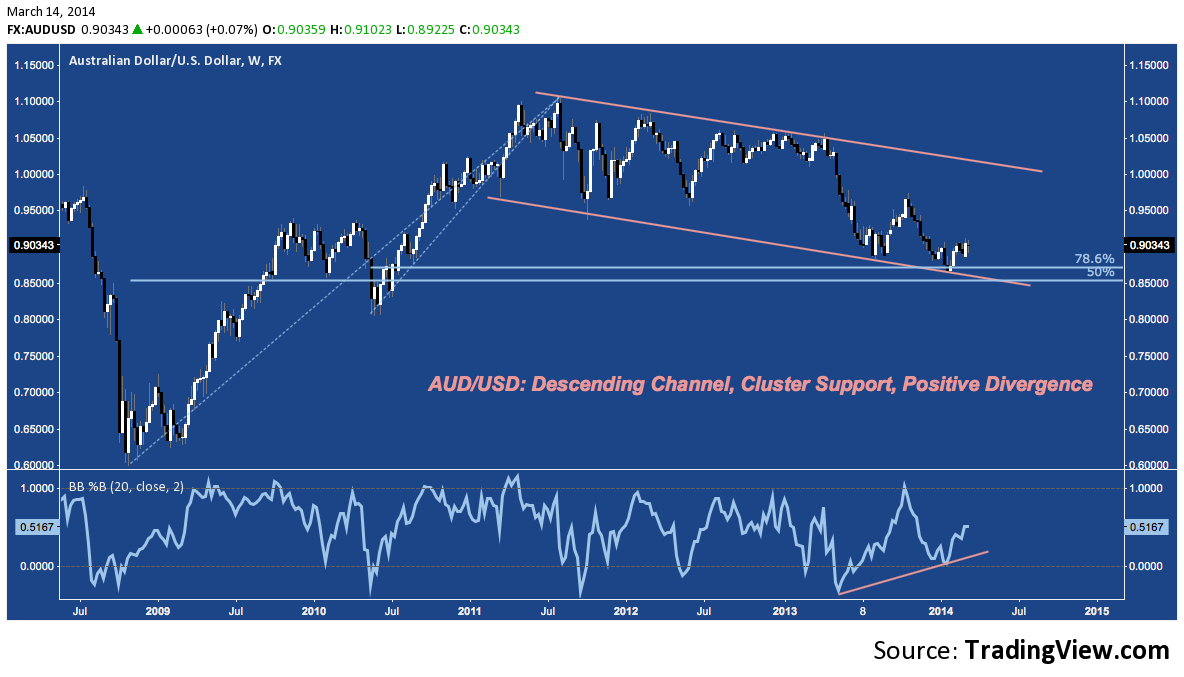
AUD/USD – Weekly: Descending Channel
The Aussie bounced in early February near 0.86 off of Descending Channel and fibonacci cluster support. Modest demand has materialized for the Australian Dollar thus far, but the significant positive divergence on %B (see lower panel) suggests upside momentum could catch from here.
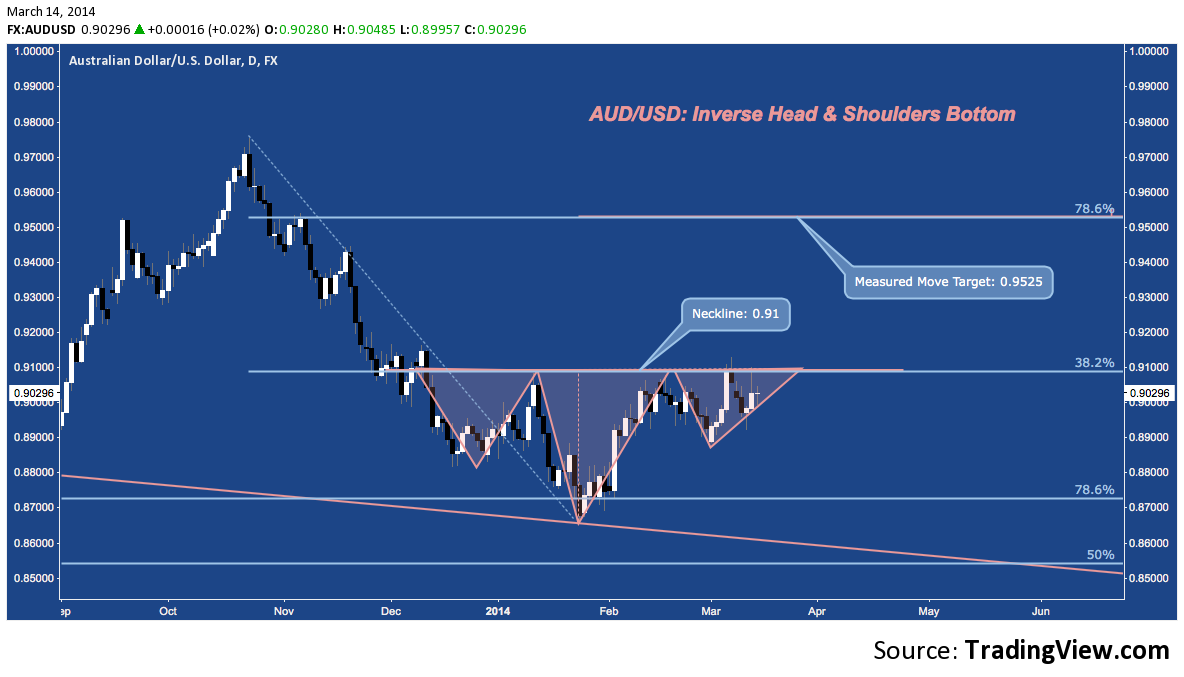
AUD/USD – Daily: Inverse H&S Bottom
A potential Inverse H&S Bottom activating with a break above 0.91 would turn “upside momentum” from vague into concrete. Over this horizontal resistance level (in place since December), a measured move targets 0.9525.
Remainders
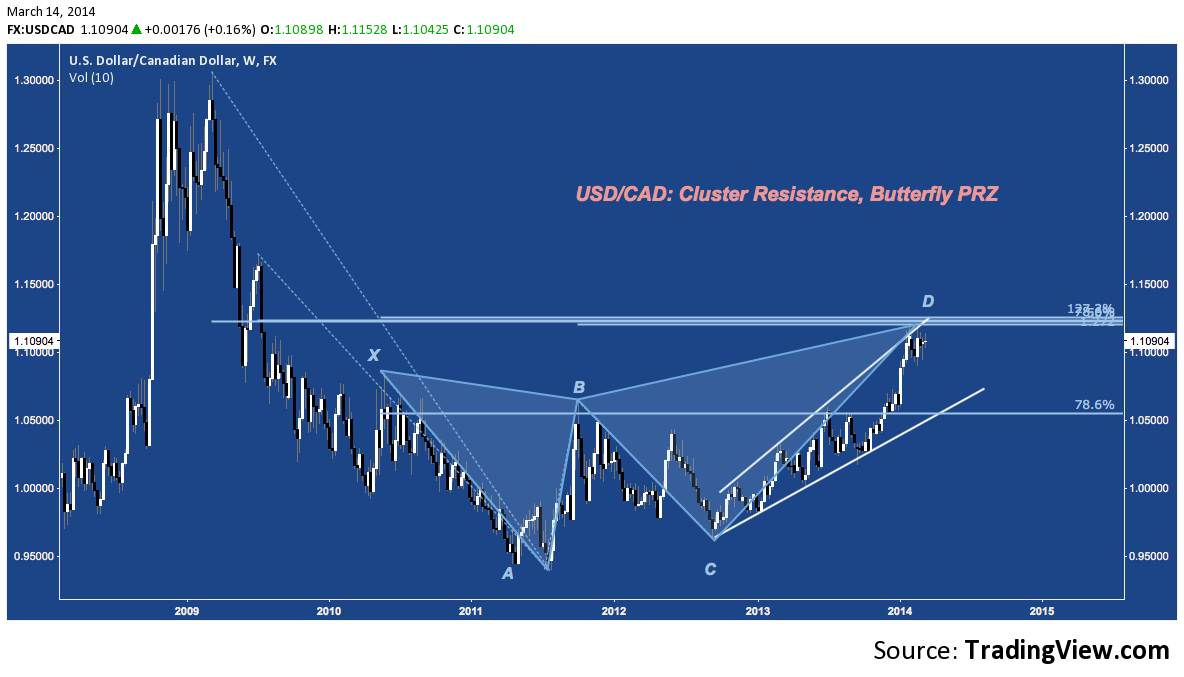
USD/CAD – Weekly: Cluster Resistance, Butterfly PRZ
The US Dollar/Canadian Dollar has moved aggressively higher over the last 16 months. Now, the Loonie is encountering a confluence of fibonacci cluster resistance, a Bearish Butterfly PRZ and Ascending Broadening Wedge trend line resistance near 112 at D.
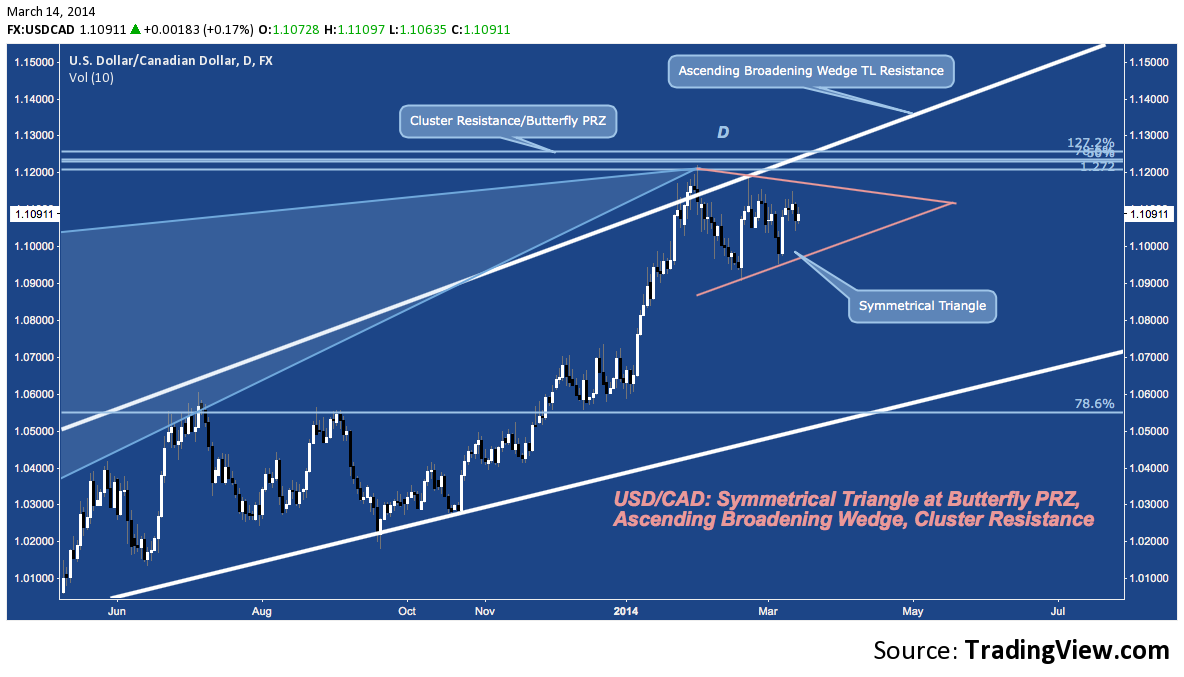
USD/CAD – Daily: Symmetrical Triangle
Just beneath 1.12, the pair has spent 2 months consolidation late 2013’s upside move in a symmetrical triangle. Above this pattern, a legitimate test of 1.12-1.13 cluster resistance looms; below, the way is open below 1.09 horizontal support to the late June/December fulcrum level at 1.06.
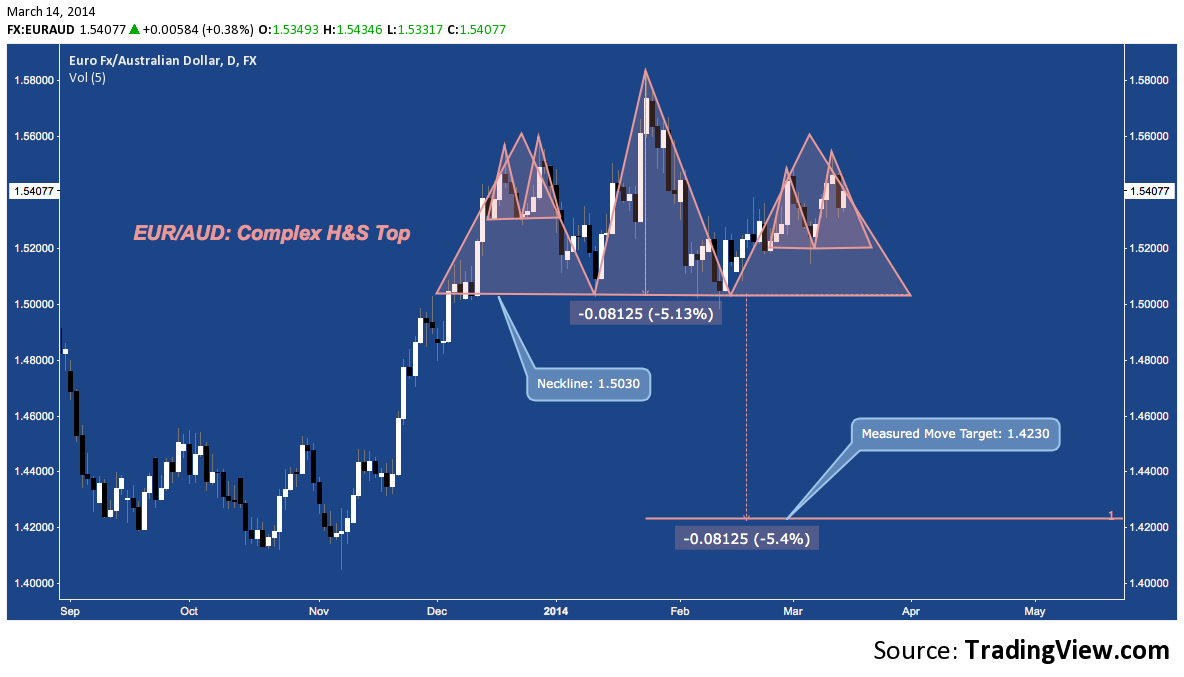
EUR/AUD – Daily: Complex H&S Top
The Euro/Australian Dollar, in contrast to AUD/USD, has developed a potential complex H&S Top. The right shoulder of this pattern would first double top with a break beneath 1.52. If there’s follow through beneath this smaller pattern, the larger H&S Top neckline support comes in at 1.5030. A break here targets a measured move 5.4% lower to 1.4230.
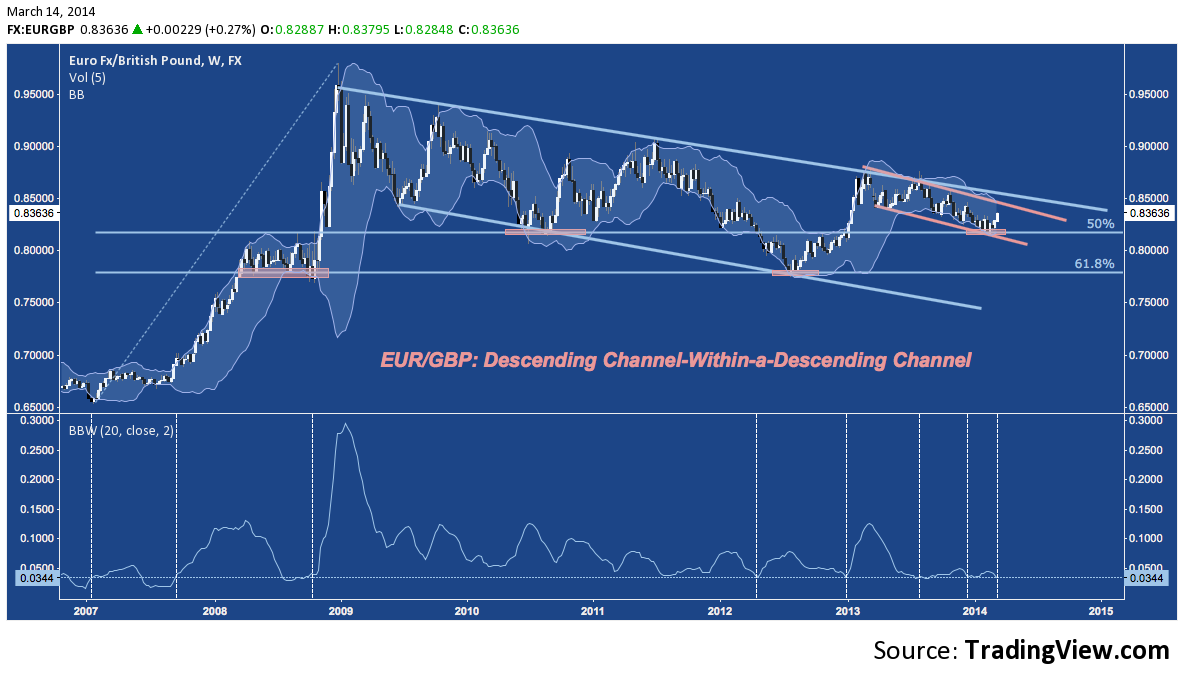
EUR/GBP – Weekly: Descending Channels
EUR/GBP continues it’s slow, slow grind in the GBP’s favor, winding through 5-year and smaller 1-year descending channels. After finding support at the 50% retracement of its 2007-2008 range in January February, the pair has turned up, but it’s Bollinger Band Bandwidth remains at it’s lowet level since late 2008. The lower panel below indicates shows the BBW and plots vertical lines where bandwidth opened up from the current level in the past. This suggests the current ebb in EUR/GBP’s range is rare and that directional volatility will soon pick up significantly.
Twitter: @andrewunknown and @seeitmarket
Author holds no exposure to instruments mentioned at the time of publication. Commentary provided is for educational purposes only and in no way constitutes trading or investment advice.
Charts courtesy of TradingView.com Lead image courtesy euroturkey.net.
Any opinions expressed herein are solely those of the author, and do not in any way represent the views or opinions of any other person or entity.


