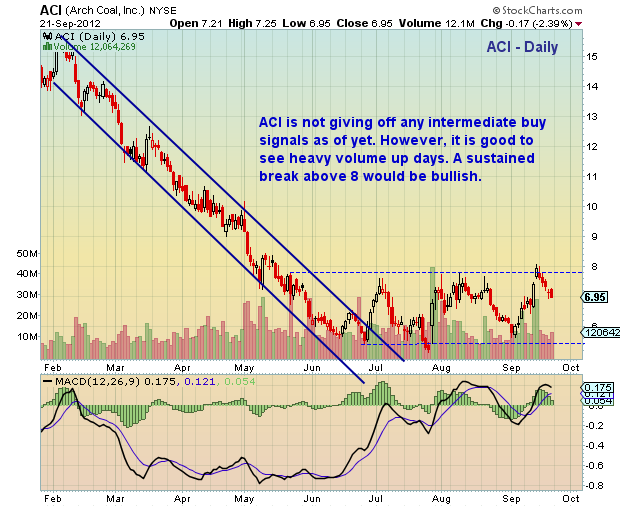
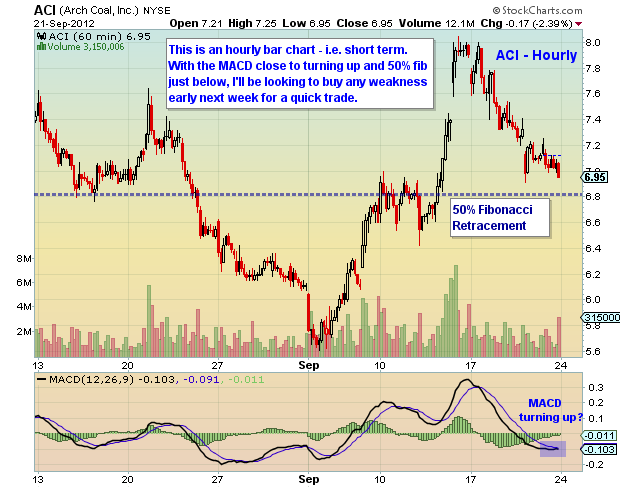
 Arch Coal (ACI) pushed higher into the Fed’s announcement of QE3 but has since given back a chunk of those gains. Many investors are anxious to get in on the reflation trade and are starting to look at beaten down coal stocks. My thoughts on an intermediate term basis are that ACI may be basing, but that confirmation will come from a break of the sideways chop. A sustained break above 8 would be bullish and offer a risk defined trade.
On a very short term basis, ACI is nearing the 50 percent Fibonacci retracement level around 6.82 (see hourly bar chart below). This could offer opportunity for the nimble, and short term.
Trade safe, trade disciplined.
More charts found here.
Arch Coal (ACI) charts with technical support and resistance as of September 21, 2012. ACI stock analysis with trend lines and fibonacci retracement support. ACI technical analysis post QE3. ACI – Coal Sector.
———————————————————
Twitter: @andrewnyquist and @seeitmarket Facebook: See It Market
No position in any of the securities mentioned at the time of publication.
Any opinions expressed herein are solely those of the author, and do not in any way represent the views or opinions of his employer or any other person or entity.


