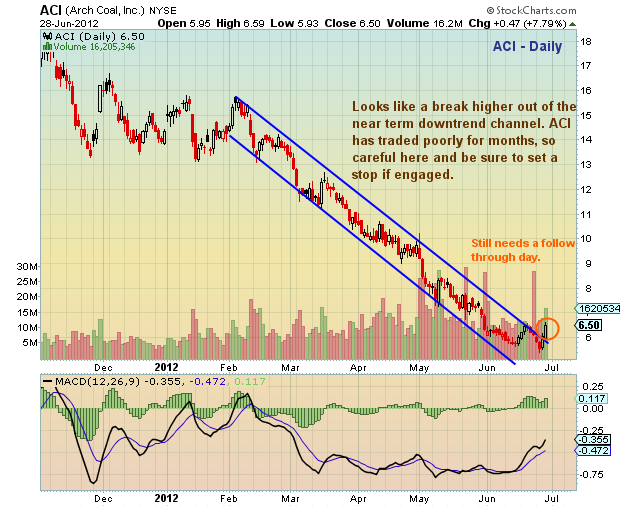
 Watch Arch Coal (ACI) has been in a series of recent downtrends, the most recent being one from 15 dollars down to 5 bucks and change. This downtrend channel was broken to the upside today. This looks to be a tradable breakout, but keep in mind the price malaise over the past year and a half (from $35 to $5), so set stops and right-size positions.

Arch Coal (ACI) annotated stock chart with technical analysis overlay as of June 28, 2012. Price support and resistance levels with trend lines and channels. Coal Sector. Arch Coal stock ticker is ACI.
———————————————————
Twitter: @andrewnyquist and @seeitmarket Facebook: See It Market
No position in any of the securities mentioned at the time of publication.
Any opinions expressed herein are solely those of the author, and do not in any way represent the views or opinions of his employer or any other person or entity.


