 By Andrew Nyquist
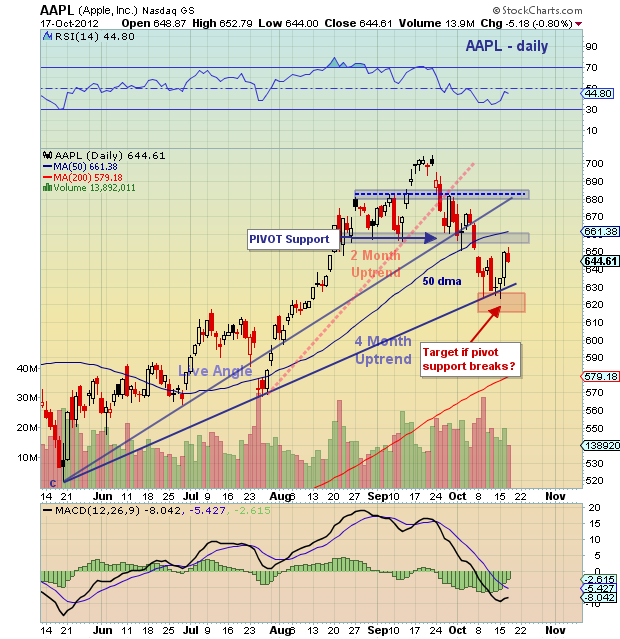
Last time I looked at Apple (AAPL), the stock was teetering on important support. At the time, I offered a lower target around 615-625 based on a confluence of support. The stock fell to 623ish (albeit briefly) and began a multi-day bounce higher. So, now what?
As with many stocks that slip out of bearish patterns, they tend to get magnetized back to the level from which they broke down. For Apple, that level is 650-660 (pivot). The action in and around this price level needs to be monitored closely. A sustained move through 660 would be constructive for bulls, whereas a stone wall here would leave open the possibility of a retest or even lower targets. So keep an eye on this pivot zone.
Trade safe, trade disciplined.
Read previous AAPL chartology, Apple Stock on the Ropes.
More Charts here.
Apple (AAPL) stock chart as of October 17, 2012. AAPL technical support and resistance levels with trend lines and technical analysis. AAPL head and shoulders pattern.
———————————————————
Twitter: @andrewnyquist and @seeitmarket Facebook: See It Market
No position in any of the securities mentioned at the time of publication.
Any opinions expressed herein are solely those of the author, and do not in any way represent the views or opinions of his employer or any other person or entity.


