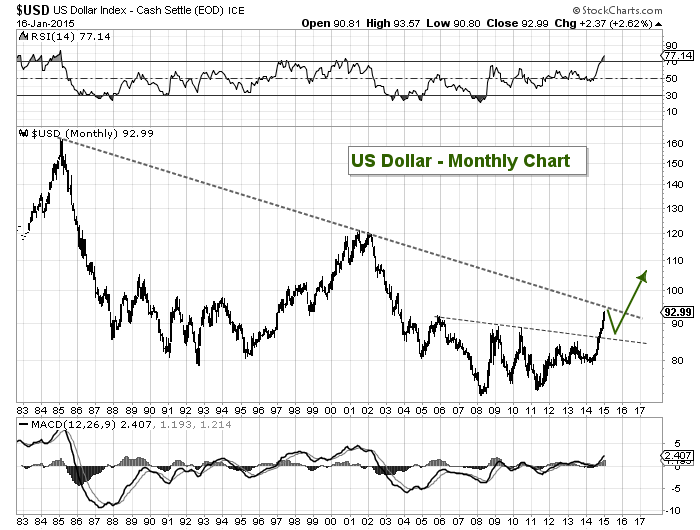
The US Dollar Index has been chugging higher for 7 straight months. And each time it looks ready to pullback, it recharges its engine and goes higher. Many investors probably downplayed the rising Dollar because, amongst other things, it was still in a long-term downtrend… well it’s time that we all pay close attention to that downtrend line.
The US Dollar Index is currently trading (overnight futures) above 93, with a recent high of 93.56. That is within spitting distance of its major downtrend line resistance (around 94-95). Earlier this year, fellow contributor Chris Kimble shared some US Dollar sentiment data and asked if the US Dollar Was Ready To Change The Financial Landscape.
That’s a fair question, because a breakout of the US Dollar Index would certainly rattle some cages and change the complexion of several asset classes.
Here’s a likely pathway for a breakout higher… although we’ll have to stay glued to the collapsing Euro to see if the highly anticipated ECB bond-buying news will stem the tide or push the Euro even lower.
US Dollar Index Monthly Chart
Follow Andy on Twitter: @andrewnyquist
No position in any of the mentioned securities at the time of publication. Any opinions expressed herein are solely those of the author, and do not in any way represent the views or opinions of any other person or entity.

: Worrisome to Broader Market?")

