Monitoring Inflation
I was scanning through some charts today and found something that I found quite amazing in regard to inflation expectations.
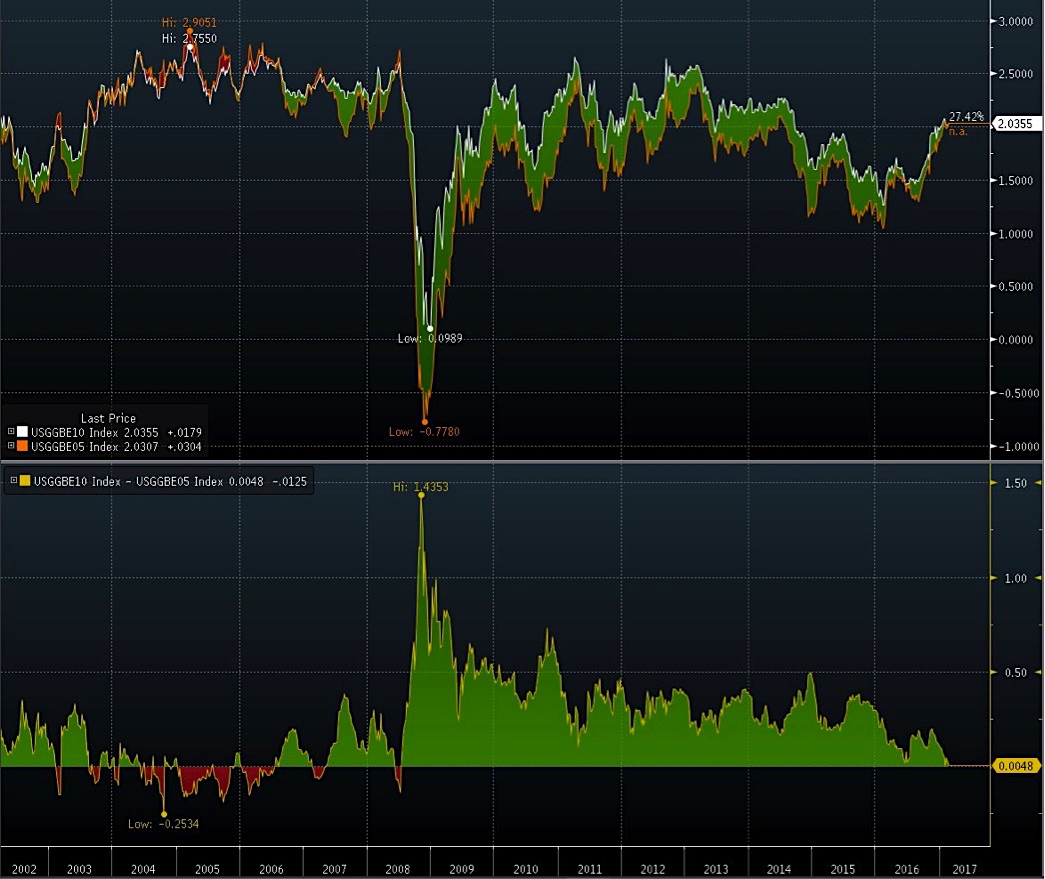
The chart below depicts the spread between the ten-year U.S. breakeven minus the five-year U.S. breakeven inflation rates.
What are inflation breakevens? These indices are calculated by subtracting the real yield of inflation from the closest nominal Treasury maturity. The spread between five-year inflation and ten-year inflation is at the flattest levels since 2008. The spread collapsed right after Trump was elected back in November because the market is anticipating pro-growth policies from Washington.
Now we just have to wait to see if the market is right…
Thanks for reading.
The material provided is for informational and educational purposes only and should not be construed as investment advice. All opinions expressed by the author on this site are subject to change without notice and do not constitute legal, tax or investment advice.
Twitter: @stockpickexpert
The author or his clients may have positions in mentioned securities at the time of publication. Any opinions expressed herein are solely those of the author, and do not in any way represent the views or opinions of any other person or entity.


