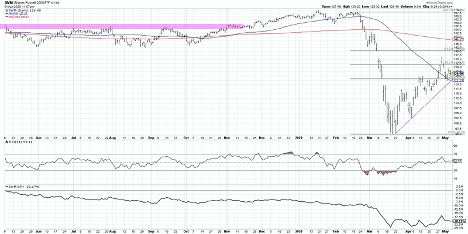
My “One Chart” for today is a chart of the iShares Russell 2000 ETF NYSEARCA: IWM
At the bottom of the chart you’ll see the relative performance of the Russell 2000 ETF (IWM) vs the S&P 500, and this long-term underperformance of small caps vs large caps is hopefully not a surprise to anyone.
This phenomenon of large and mega cap stocks dwarfing the performance of small caps has been an ongoing, chronic issue. And it’s not just new to the downturn.
This underperformance really accelerated mid-February to mid-March. As the market fell off a cliff, small caps certainly led the way down.
Then you’ll notice a period of stability. From mid-March to mid-April, you’ll see a flat relative performance where small caps and large caps were both recovering at a pretty decent clip.
Since then, we’ve started to see a relative strength breakout. The relative strength of the IWM actually made a new 6-week high, which on its own doesn’t really signal dramatic outperformance. This is just the beginning, but it’s improving and is looking stronger rather than weaker.
Looking at large caps, the S&P 500 is testing the 61.8% resistance Fibonacci level. It’s also nearer to its 200-day moving average which is right around 3000.
The IWM, on the other hand, broke above its 50% retracement but then came back and is now sitting right around its 38.2% retracement of the February to March selloff. If you buy into the market recovery thesis and the idea that things are going to get better, then this chart should continue to make higher highs and higher lows.
This is the pattern we’ve seen since mid-March. We had the low the 3rd week in March, then the rally and subsequent pullback into the 1st week in April. This pattern continued with the high the last week in April (just above $137), then the pullback to that 38.2% retracement level.
I see two possible paths emerging here.
If this short-term tactical uptrend remains, where the IWM continues this pattern of higher highs and higher lows, I think you have to believe that the market will recover further from here. And if that happens, I would not be surprised to see the S&P break above 3000 on its way to previous highs of 3400 or beyond.
Alternatively, we may start to see a break down with a lower high, a swing low below $122 (the low from the 1st week in May), and a break below trendline support using the lows from late March and early April. If these things happen, and if the IWM breaks below that 38.2% retracement level, you have to believe that the market could get much weaker from here.
When the market goes down, people tend to flee to the big cap/technology “safety trade”, or the MAGA or FAANG trade. Based on what I’m seeing, I think the most likely outcome is a breakdown in small caps before a breakdown in the S&P 500. The IWM will likely break below the 38.2% level, down through trendline support, and continue below its 50-day moving average while the S&P still might maintain more of a stable equilibrium.
As people rotate away from the high beta, speculative small cap trade and into the big cap, blue chip defensives, this could make the S&P remain fairly strong. The last thing investors tend to sell is Apple, Microsoft, and others that have been doing so well.
The Russell 2000 ETF is a chart I’m watching with its short-term tactical uptrend. I’ve been reminding my viewers that as long as this pattern of higher highs and higher lows continues, you have to at least be expecting further upside with stocks. Once that pattern breaks (and with the IWM we have a clear line in the sand for a signal with a break below $122), this would confirm more downside for stocks.
A break down in the relative strength of small caps would likely precede a follow-through from the S&P 500, following the small cap index further down.
To watch this in video format, just head over to my YouTube channel!
Twitter: @DKellerCMT
The author does not have a position in mentioned securities at the time of publication. Any opinions expressed herein are solely those of the author, and do not in any way represent the views or opinions of any other person or entity.


: Showing Some Signs of Emerging Strength")
