The Shanghai Stock Exchange (SSEC) fell 8.5 percent overnight highlighting just how unsettled investors are in that market. That drop has translated to a 4.3 percent drop on the iShares China ETF (FXI) as the U.S. markets near the last 30 minutes of the trading day.
I’m not all that surprised because the original 30 percent selloff created a lot of overhead supply. So even though we saw a sharp rally into last week, it was into strong resistance. Here’s a note from my post on June 17:
And following a breathtaking drop, a sharp FXI rally has unfolded. Is this a V bottom, or a sharp bear rally? I’d lean with the latter…
Below is a chart on the Chinese stock market ETF (FXI) – updated with new bars. It shows the overhead resistance levels that I highlighted on June 17:
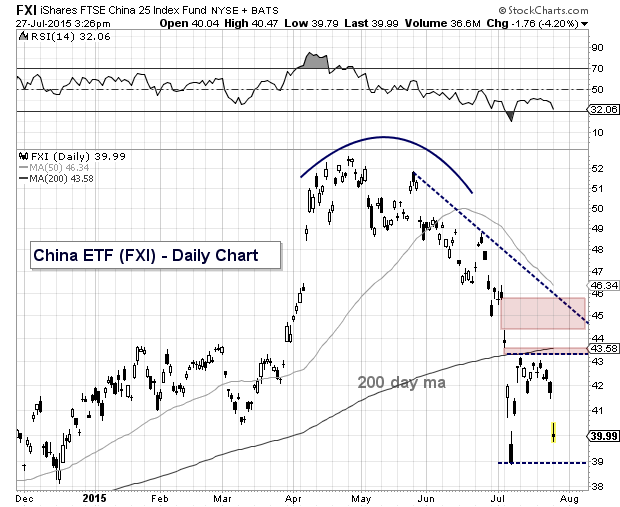
One development that could create a trading setup is if we see new price lows and a higher low on the RSI (called an RSI divergence). But as many seasoned traders will tell, picking bottoms is a dangerous game. The Chinese stock market carries a lot of overnight risk right now so no need to be a trading hero here.
Those that are bullish on the Chinese stock market over time should put together a plan that includes scaling (i.e. dollar cost averaging). The FXI is currently down 24 percent from its April highs, while the Shanghai Stock Exchange is currently down 28 percent from its June highs. A Chinese regulator vowed more support for the market after its latest crash.
Both the index and the ETF are fast approaching their lows – the next week or two should be interesting.
Twitter: @andrewnyquist
The author does not have a position in any of the mentioned securities at the time of publication. Any opinions expressed herein are solely those of the author, and do not in any way represent the views or opinions of any other person or entity.


 Analysis: Bulls Eye Down-Trend Line")


