Recently, I have been collaborating on a research project with Arun Chopra, a good friend who holds a CFA and CMT. Together, we have been blending longer-term fundamental indicators with technical indicators to do historical studies. Today, we’ll look at a chart, that together with its indicators has lead to bear markets in the past.
The chart below is just one of many research charts and insights that we share, looking across multiple time frames.
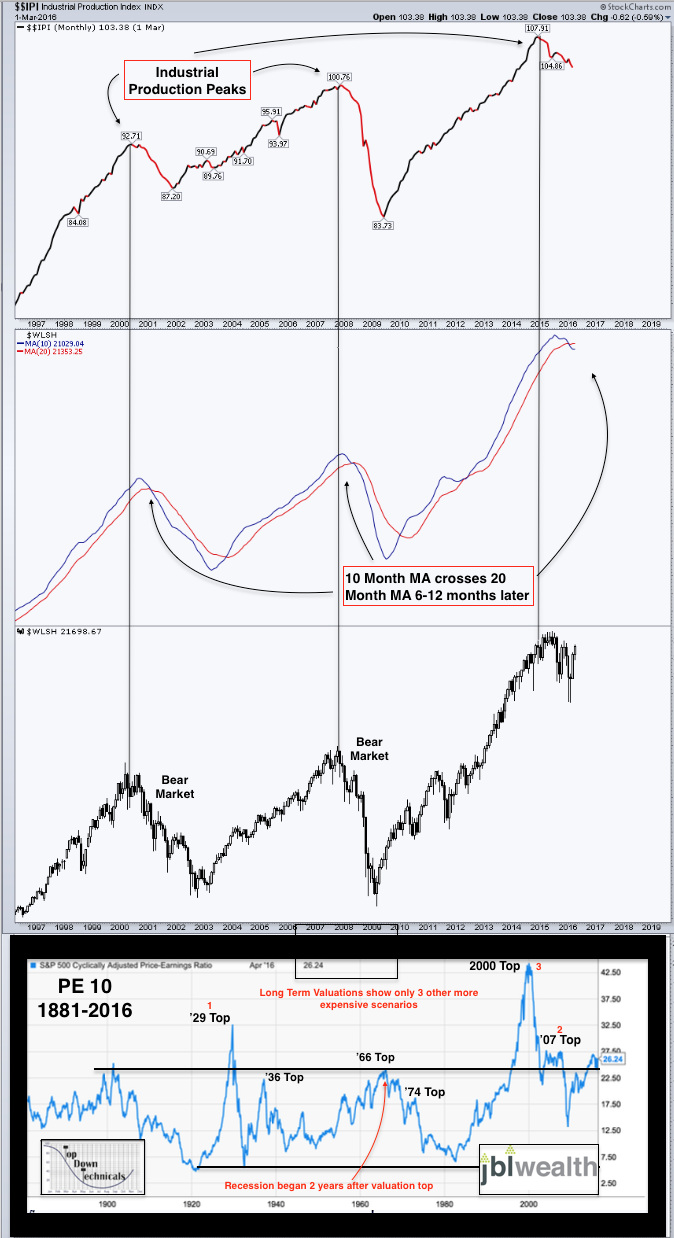
This chart, however, is more of a macro historical look at a few indicators. And it should give market bulls pause here.
Similar circumstances produced bear markets. Is this time different?
- Industrial Production peaks
- Wilshire 10 month moving average cross 20 month average 6-10 months later
- 4th highest valuation period on record
Chart of the Day – Is It Different This Time?
Thanks for reading and have a great weekend.
More from Jason: Crude Oil Insights: Doha, Drillers, And The Wrecking Bull
Twitter: @JBL73
Any opinions expressed herein are solely those of the author, and do not in any way represent the views or opinions of any other person or entity.


