It’s been an ugly couple of year for US Treasury Bonds. T-bond prices have dropped sharply as yields have risen.
This has been an added pressure on retirement portfolios as treasury bonds are no longer trading like a conservative asset.
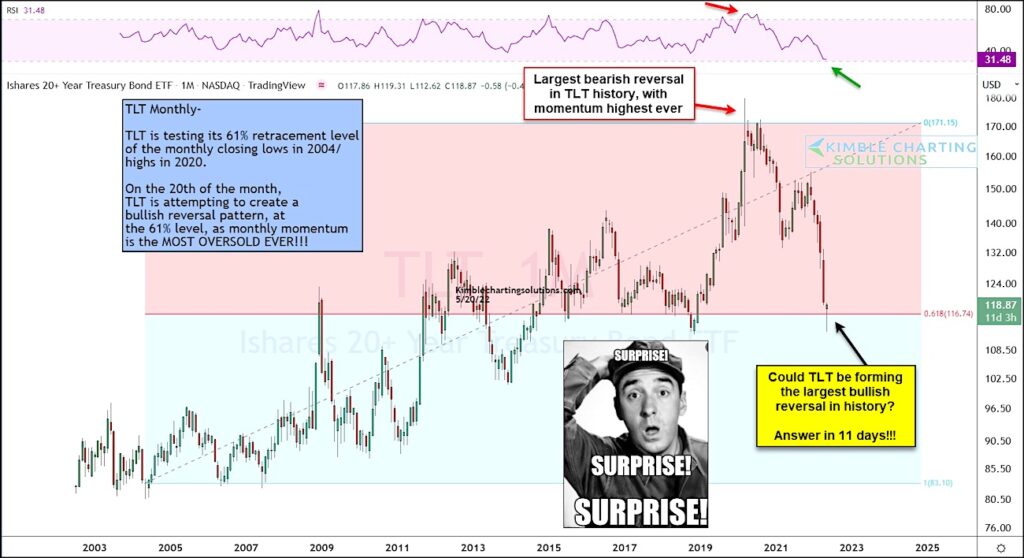
Time for a bounce in T-bonds?
Today, we take a look at the long-term “monthly” chart of the 20+ Year US Treasury Bond ETF (TLT).
As you can see, 2 years ago bonds peaked and formed a historic bearish reversal pattern at the highest momentum reading ever.
Since then, bonds have been in a sharp decline. Currently, the treasury bonds ETF (TLT) is testing important support at its 61.8 Fibonacci retracement level (using 2004 lows / 2020 highs). So far this month TLT has rallied back from a sharp decline.
Could TLT form an equally impressive bullish reversal this month (from historic oversold levels)? We should know the answer at month-end! Stay tuned!!
$TLT Treasury Bonds ETF “monthly” Chart
Note that KimbleCharting is offering a 2 week Free trial to See It Market readers. Just send me an email to services@kimblechartingsolutions.com for details to get set up.
Twitter: @KimbleCharting
Any opinions expressed herein are solely those of the author, and do not in any way represent the views or opinions of any other person or entity.
: Creating Bullish Divergence?")


 and Semiconductors (SMH): Concerning Price Pattern?")


