Last week I did a part educational, part actionable webinar for the virtual money show.
My theme was and always is, the Economic Modern Family.
On the weekly charts, some of the members have broken down under their 200-week moving average, while others tested and held it and others have yet to trade near it. Bitcoin is the newest member of the Family and it too held its 200-WMA support zone.
This gives us a technical picture that is pretty clear and full of actional if this/then that type of trading scenarios.
What are the economic modern family saying ahead of PPI and the FOMC?
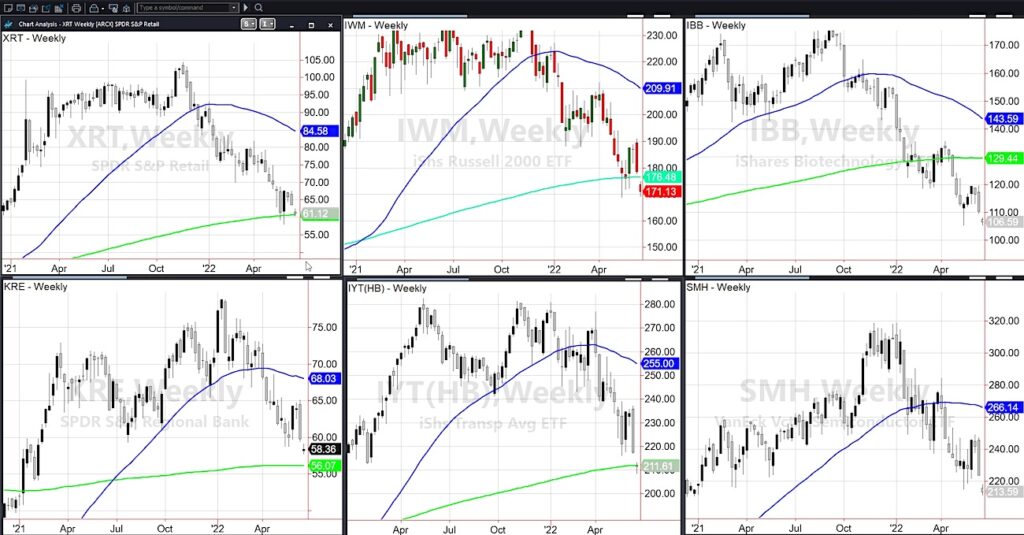
The weekly charts of the Russell 2000 IWM, Retail XRT, Biotech IBB, Semiconductors SMH, Regional Banks KRE, and Transportation IYT vary. Then add the bitcoin chart and you can see that the 200-WMA is either widely respected or decidedly rejected.
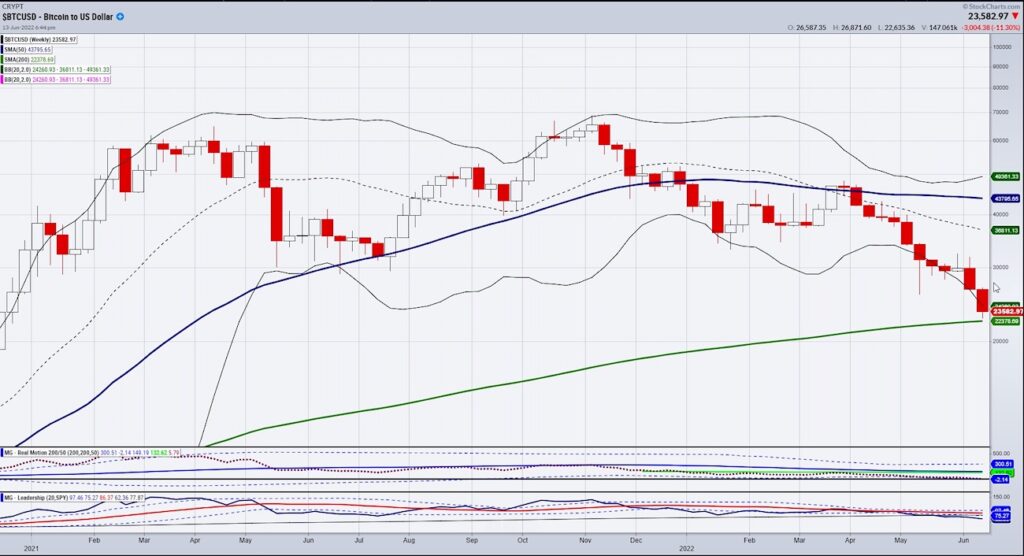
The most interesting chart just might be bitcoin as it popped about $1000 off the 200-WMA while the Russell 2000 broke decidedly below it.
What could that mean?
Bitcoin’s dominance in the crypto space keeps rising while the price liquidated on the heels of Celsius. In the past, the rising dominance has pointed to a tradeable low in bitcoin.
More importantly for right now, if BTC has any influence or can turn out as a reliable market indicator, it behooves us to watch that 200-WMA. Can it continue to hold and if so, is that an overall sigh of relief for the stock market? That is where we look to the rest of the Family. Interestingly, XRT is holding its 200-WMA.
Meanwhile, IYT or the demand side broke the 200-WMA. And KRE plus SMH are still a distance away-we can call it relative strength in banks and semis at this point.
Biotech has declined harder than any of the others. If it closes out the week above 105.39, perhaps that will be a good place to look for a bounce.
In the meanwhile, if we focus on XRT or the retail side of the economy, nobody can argue with the price weakness or abysmal consumer confidence statistic.
However, that XRT is currently outpacing IWM could be something.
A lot will depend on the CPI and the FOMC. But for now, perhaps we can draw some parallel between Bitcoin and the consumer. And perhaps, we can continue some level of patience to see if both break the 200-WMA this week for more pain.
Or if they hold and point to a bear market rally-or another opportunity to trade the trading for some quick profits.
Watch Mish’s clip on Bloomberg Markets. She discusses what she sees going forward concerning inflation, recession, the Fed and the market:
I will be on live with @Benzinga’s #PreMarket Prep Show June 14th at 8:35 AM EST.
Stock Market ETFs Trading Analysis & Summary:
S&P 500 (SPY) 380 is now pivotal price resistance with 360 as the next support.
Russell 2000 (IWM) 168.90 is the May low so will see if it can hold.
Dow Jones Industrials (DIA) 306.28 is the May low, with pivotal price support at 294.
Nasdaq (QQQ) 263 is the 200-week moving average with 280.21 price resistance.
KRE (Regional Banks) 56 is the 200-week moving average.
SMH (Semiconductors) 195 is minor price support with 220 resistance.
IYT (Transportation) 211.87 is the 200-week moving average to get back above.
IBB (Biotechnology) 105.39 is a pivotal price area.
XRT (Retail) 60.62 is the important 200-week moving average support line.
Twitter: @marketminute
The author may have a position in mentioned securities at the time of publication. Any opinions expressed herein are solely those of the author and do not represent the views or opinions of any other person or entity.

: Worrisome to Broader Market?")
