Several stock market indices and sectors are nearing important trading points within various patterns.
But arguably none more important than the major technology indices.
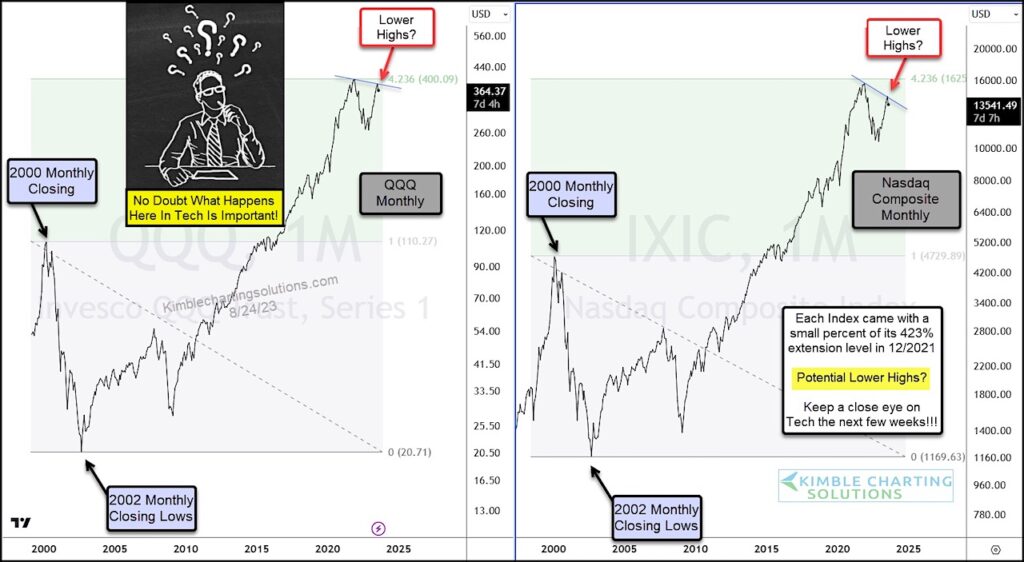
Today we highlight the Nasdaq 100 ETF (QQQ) along with the Nasdaq Composite Index. As you can see, both of these “must follow” charts is showing the potential for lower highs.
A similar pattern happened in 2000 and was confirmed when new lows were made.
On the other hand, a breakout over falling resistance would be bullish.
Lower highs or breakout, it’s clear that what happens next will be important from this market leader. Stay tuned!
Nasdaq 100 ETF (QQQ) and Nasdaq Composite “monthly” Charts
Note that KimbleCharting is offering a 2 week Free trial to See It Market readers. Just send me an email to services@kimblechartingsolutions.com for details to get set up.
Twitter: @KimbleCharting
Any opinions expressed herein are solely those of the author, and do not in any way represent the views or opinions of any other person or entity.
: Cup (and Maybe Handle) Watch")
 Trading Near Top Of Price Range")
 Reaches Important Price Support")