S&P 500 Index Trading Outlook (3-5 Days): Bullish
We remain bullish barring a close under 2877. Our upside target 2945-50.
Overall the S&P 500 is now right underneath resistance at 2945-50 which is thought to be important.
This price level could cause at least some near-term stalling out if reached on Wednesday-Friday of this week. Above that however, and there is no meaningful price resistance until 3040-70.
That upside price target (3040-3070) is an area that lines up with Gann’s Square of Nine targets and projections from both last December’s lows (along with prior highs from 2007).
This spot is thought to be an important area to sell into this rally.
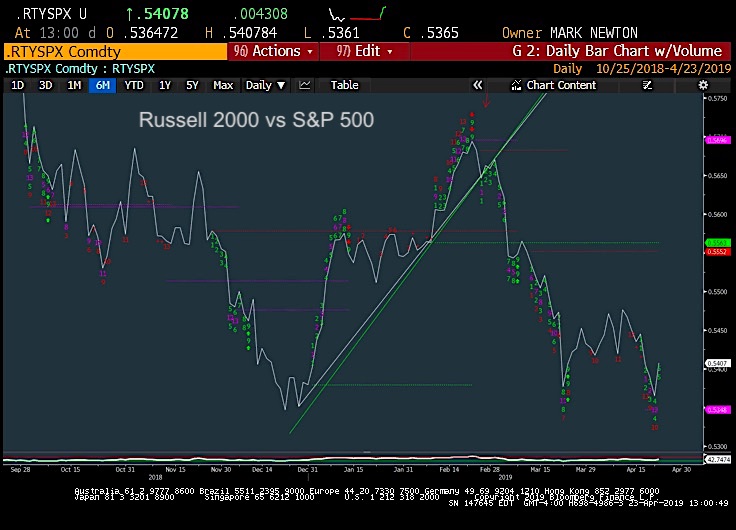
Chart Spotlight: Russell 2000 vs S&P 500 Chart
Russell 2000 vs SPX looks poised to turn higher near-term after some severe underperformance in recent months. Charts of IWM have turned more positive this week and look likely to play catchup to other indices in moving back to new highs for 2019. Relative charts of the Russell 2000 vs SPX show two prior lows at hand, and now recent weakness has hit those same levels and showed some real strength on Tuesday. Thus, an oversold bounce looks likely in Small-caps.
Yesterday’s breakout back to new all-time highs for SPX and NASDAQ Composite broke a string of nearly 5 days of little to no real net change. Breadth expanded to near 3/1 bullish and we saw encouraging signs of Healthcare snapping back which had been sorely lacking in recent weeks. While encouraging from a price standpoint, only 50% of the market was trading above its 10-day moving average heading into Tuesday’s session. Furthermore, only 45 new NYSE new 52-week highs were seen heading into yesterday, which had been cut in half since mid-April back on 4/12 when this registered 122 new Highs.
Overall, it’s thought that a push to new highs should be broad-based and inclusive, with an increasing amount of names at new 52-week highs, not a situation where this has been halved. However, until some evidence of price weakness occurs, seeing indices move back to new high territory typically is not a bearish development.
3 things look appealing now that SPX is back at new all-time highs: 1) Buying Small-caps This group has lagged substantially, but turned up sharply on Tuesday, with IWM having made a very bullish near-term chart. This looks to break out to new highs in the days ahead and Small-caps look poised to bounce. 2) Buying Healthcare. We’re approaching a seasonally strong time for this group to outperform and yesterday’s surge saw Healthcare outperform all other 10 Sectors. It’s thought that further gains can occur in the short run, though charts have been damaged and some real recovery of former lows is necessary in many names to have some confidence. 3) Gold stocks are starting to look appealing again after sharp drops down to areas of technical support. This area has some appeal from a counter-trend perspective.
If you have an interest in seeing timely intra-day market updates on my private twitter feed, please follow @NewtonAdvisors. Also, feel free to send me an email at info@newtonadvisor.com regarding how my Technical work can add alpha to your portfolio management process.
Twitter: @MarkNewtonCMT
Author has positions in mentioned securities at the time of publication. Any opinions expressed herein are solely those of the author, and do not in any way represent the views or opinions of any other person or entity
 Ready To Break Out?")


 Rolling Over At Key Fibonacci Level?")

