The S&P Retail Sector (NYSEARCA:XRT) has been an underperformer for the better part of the past 2 years. The sector has been sputtering in 2017 and many portfolio managers may have it listed as a sector to “avoid”.
But that dynamic may be changing as retail stocks are starting to perk up… and look ready to show some relative strength in the weeks ahead.
Over the past few weeks, retail stocks have rallied. And this has improved the sector’s performance relative to the S&P 500 (NYSEARCA:SPY). In fact, the retail sector is attempting to break out of a bullish chart pattern (relative to the S&P).
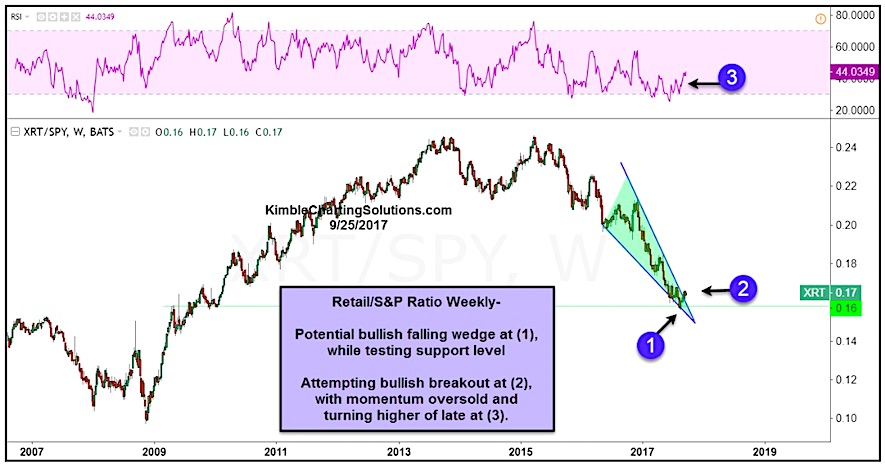
In the chart below, I have plotted the ratio of the Retail Sector (XRT) vs the S&P 500 (SPY) over the past 10 years. As you can see, retail hasn’t been in favor in 2017. However, the ratio formed a bullish falling wedge while testing price support (point 1)… and appears to be breaking out of this pattern (point 2). Momentum also reached oversold levels not seen since 2008 and has since turned higher (point 3).
This type of price action could present an opportunity for investors.
From a portfolio management perspective, the retail sector looks ready to outperform the broader market. For those looking for higher beta options than the ETF itself, you may want to look under the XRT’s hood and do a screen for individual stock components that are showing strength.
Retail Sector Relative Strength Chart (XRT:SPY)
Twitter: @KimbleCharting
Any opinions expressed herein are solely those of the author, and do not in any way represent the views or opinions of any other person or entity.


