Several key stock market indexes have rallied 2 to 3 percent since Monday’s closing prices. This is a welcome relief to bulls.
Major indexes like the S&P 500, NASDAQ Composite, Dow Jones Industrials, Dow Jones Transports, Russell 2000 and more have fallen 7 to 10 percent from their recent highs.
While we are likely to have some rough days going forward, and quite possibly another wave lower, it’s good to flip the script and point out the bullish side of things to keep things in perspective.
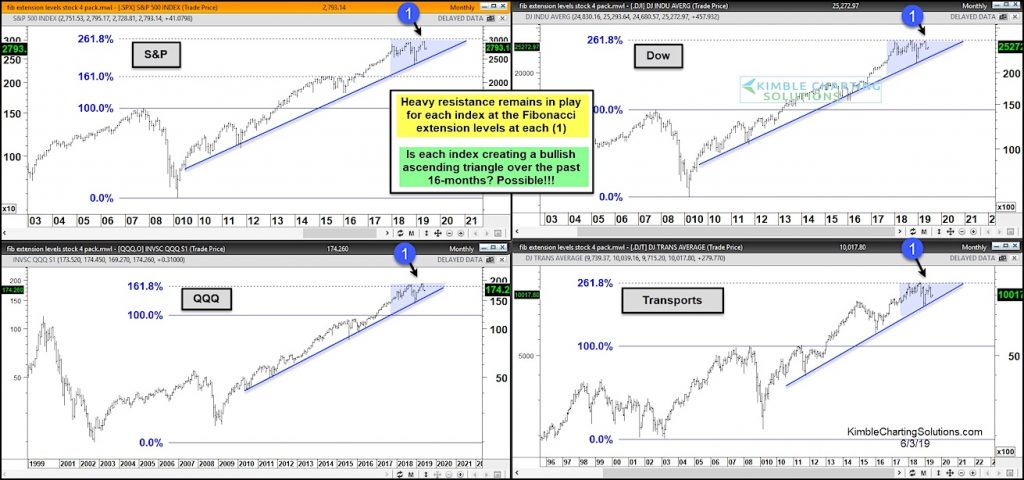
Today we look at a long-term chart of several key stock market indexes, including S&P 500, NASDAQ, Dow Jones Industrials, and Dow Jones Transports. And what we see is potentially bullish.
As you can see in the chart below, heavy resistance remains in play for each index at their Fibonacci extension levels at (1).
BUT, these extension levels may be the top of a bullish ascending triangles, which take place in rising markets.
It would take breakouts above these Fibonacci levels to prove that these are bullish ascending triangles and new highs are ahead. Stay tuned!
Key Stock Market Indices / Sectors Chart
Note that KimbleCharting is offering a 2 week Free trial to See It Market readers. Just send me an email to services@kimblechartingsolutions.com for details to get set up.
Twitter: @KimbleCharting
Any opinions expressed herein are solely those of the author, and do not in any way represent the views or opinions of any other person or entity.
: Creating Bullish Divergence?")


 and Semiconductors (SMH): Concerning Price Pattern?")


