Investors have listened the the Federal Reserve talking about raising interest rates for the past year. But, the majority of investors haven’t bought into this theme. This has stretched the government bonds bull market to new highs… and as bond prices (NASDAQ:TLT) rise, yields go lower and lower.
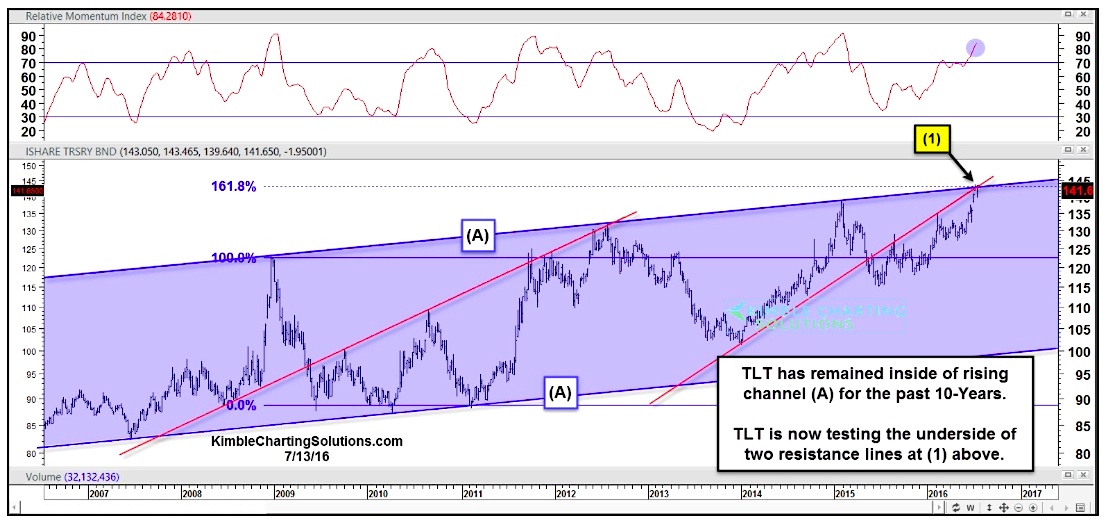
The chart below takes a look at the 20 Year U.S. Treasury Bond ETF (TLT) over the past decade.
It’s clear that the government bonds bull market (via TLT) remains in a 10 year rising trend channel – see point (A).
That said, the rally in TLT this year, has pushed bond prices to the upper end of the rising channel (resistance). It actually touched up against resistance in the past week. Note the confluence of two potential resistance lines at point (1) above.
To be fair, we must see both sides here. There is a chance that TLT breaks out above channel resistance. Note, though, that weekly momentum is now reaching lofty levels.
Is it possible that the S&P 500 Index (INDEXSP:.INX) is making new highs while treasury bonds peak (at the same time)?
The 20 year treasury bonds ETF (TLT) is at a very interesting price point in time.
Thanks for reading.
Read more from Chris: Silver Rally Breaks Out Of Bullish Wedge Pattern
Twitter: @KimbleCharting
The author does not have a position in related securities at the time of publication. Any opinions expressed herein are solely those of the author, and do not in any way represent the views or opinions of any other person or entity.


 Pressuring Lower Price Support")