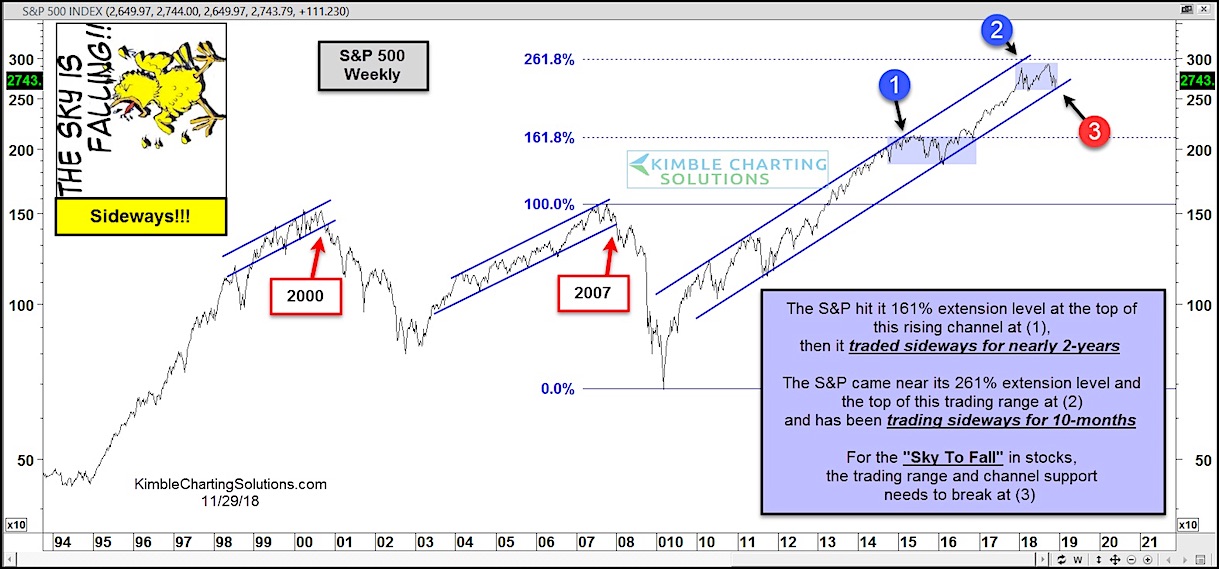
While many analysts are talking about the sky falling in stocks, the chart below reflects that the S&P 500 (NYSEARCA: SPY) may simply be in a sideways trading range.
As well, the S&P 500 remains within the uptrend channel (testing the lower support).
Seen this price action before? Yep, back in 2015-2016. At that point (1), the S&P 500 has just hit its 161.8% Fibonacci extension level at the top of the uptrend channel. That prompted a sideways trading ranges for several months.
This year, the S&P 500 hit its 261% Fibonacci extension level and has proceeded to trade sideways yet again at point (2). This has last 10 months thus far, but a resolution is nearing…
If the sky is to fall in stocks, the trading range and channel support needs to break lower at point (3).
As long as support holds, this bull is still alive. Stay tuned!
S&P 500 Weekly Chart
Note that KimbleCharting is offering a 2 week Free trial to See It Market readers. Just send me an email to services@kimblechartingsolutions.com for details to get set up.
Twitter: @KimbleCharting
Any opinions expressed herein are solely those of the author, and do not in any way represent the views or opinions of any other person or entity.


