The October stock market correction caused damage that has not been fully repaired just yet… despite the stealth 8 percent rally off the October 29 low.
In this research note, we take a look at several inter market relationships and relative performance ratios to provide a broad look at the market’s health.
High Yield to Treasuries Ratio
The ratio of HYG (high yield) to IEF (intermediate-term treasuries) has rallied to retake the 200-day moving average but remains in the range which has marked trading for the past two years. The RSI is in neutral ranges and is not signaling a move one way or the other. A breakout would be a positive for equities while a breakdown would be negative for the market.
Current Trend: NEUTRAL

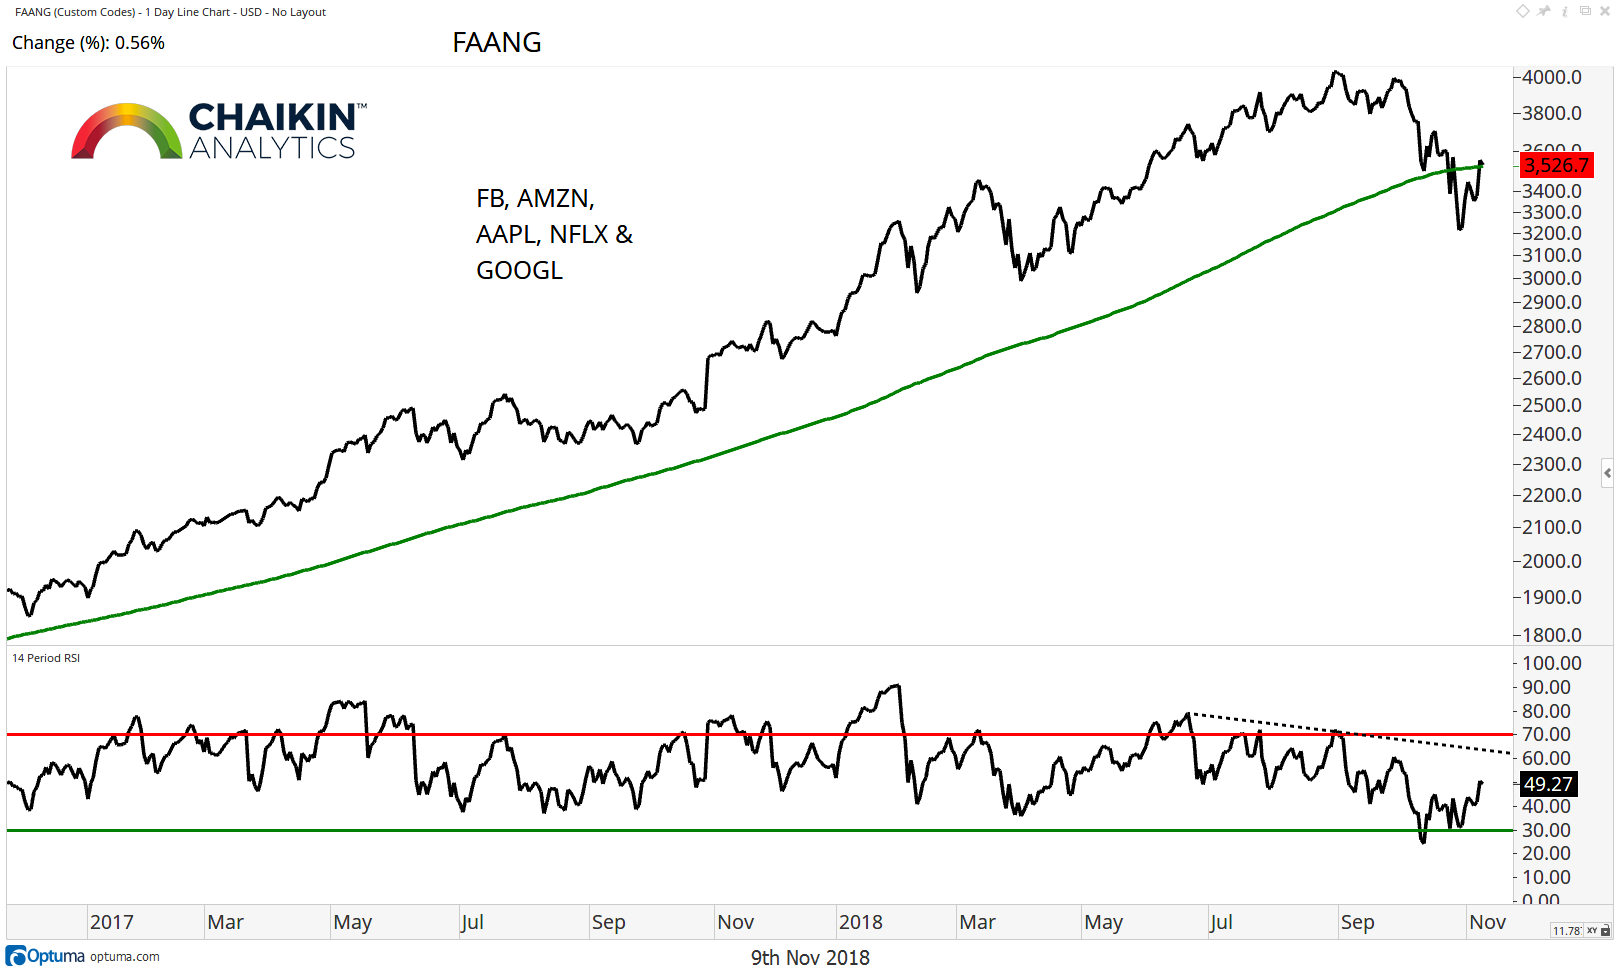
FAANG Stocks
The FAANG Stocks Index (Facebook – FB, Amazon – AMZN, Apple – AAPL Netflix – NFLX & Google – GOOGL) have rallied back to test the 200-day moving average. The RSI has logged a series of lower highs and recently became oversold for the first time in over two years. Should this index stabilize and move higher, it would be a signal that the generals are once again leading, with bullish implications for the overall equity market while a breakdown from will likely pull the market lower.
Current Trend: NEUTRAL
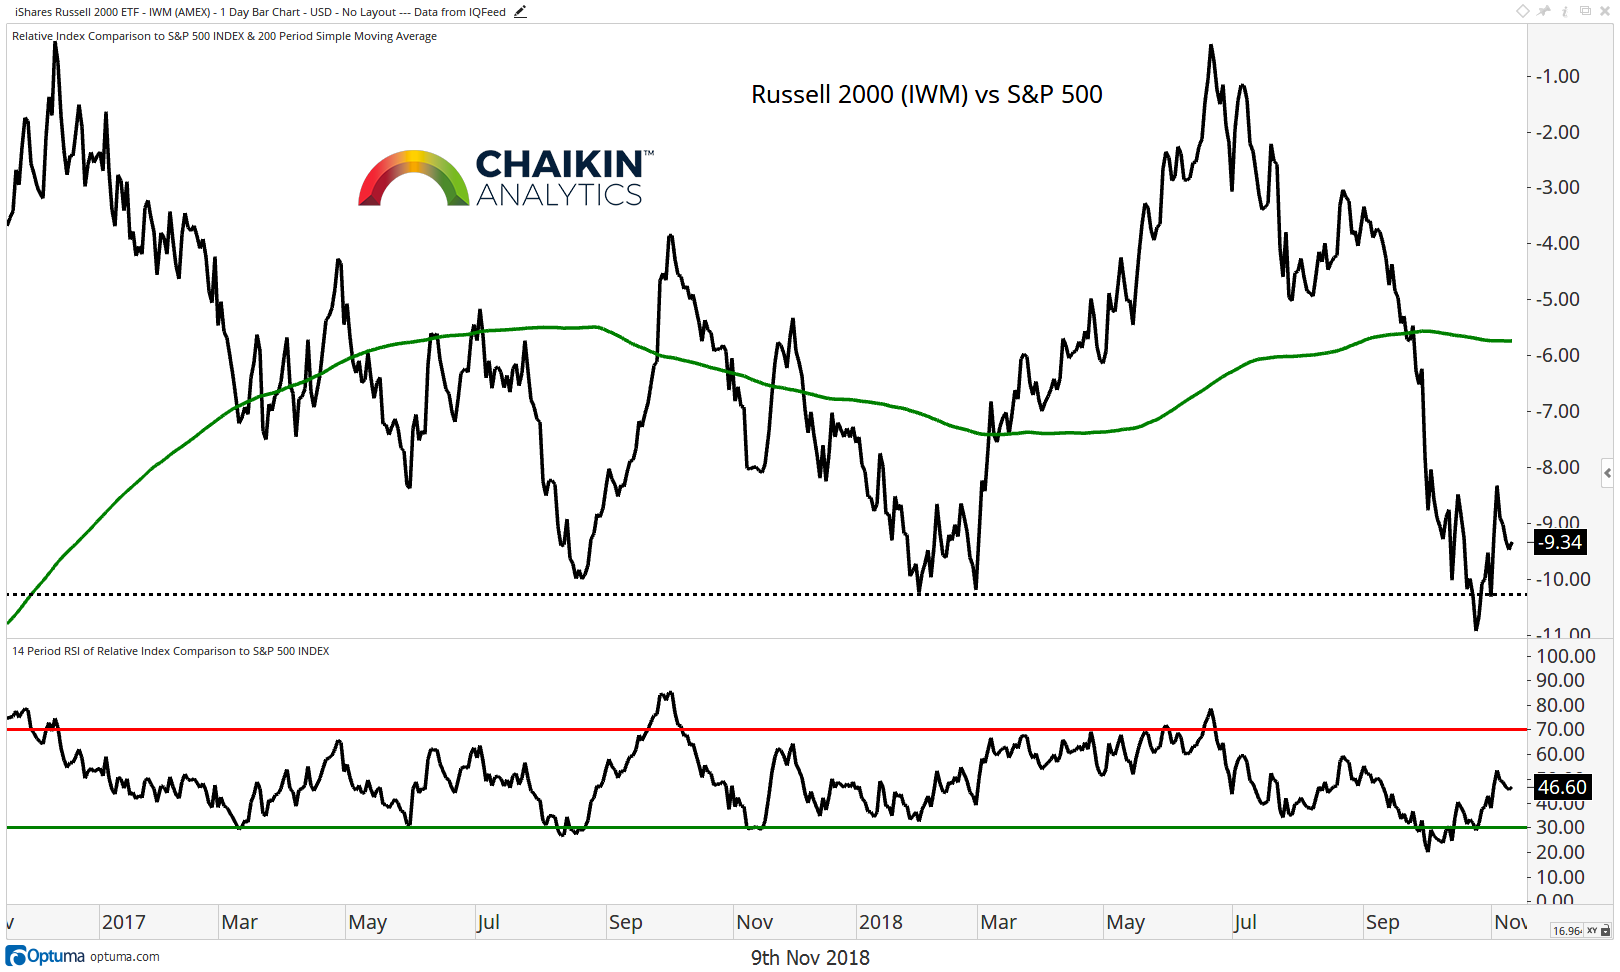
Small Cap’s Relative Performance
The small caps continue to build a base near two-year support. Here is the Russell 2000 ETF (IWM) relative to the S&P 500; the ratio remains below the 200-day moving average which is beginning to curl lower. The RSI remains in bearish ranges which speaks to the strength of the downtrend from the June highs.
Current Trend: BEARISH
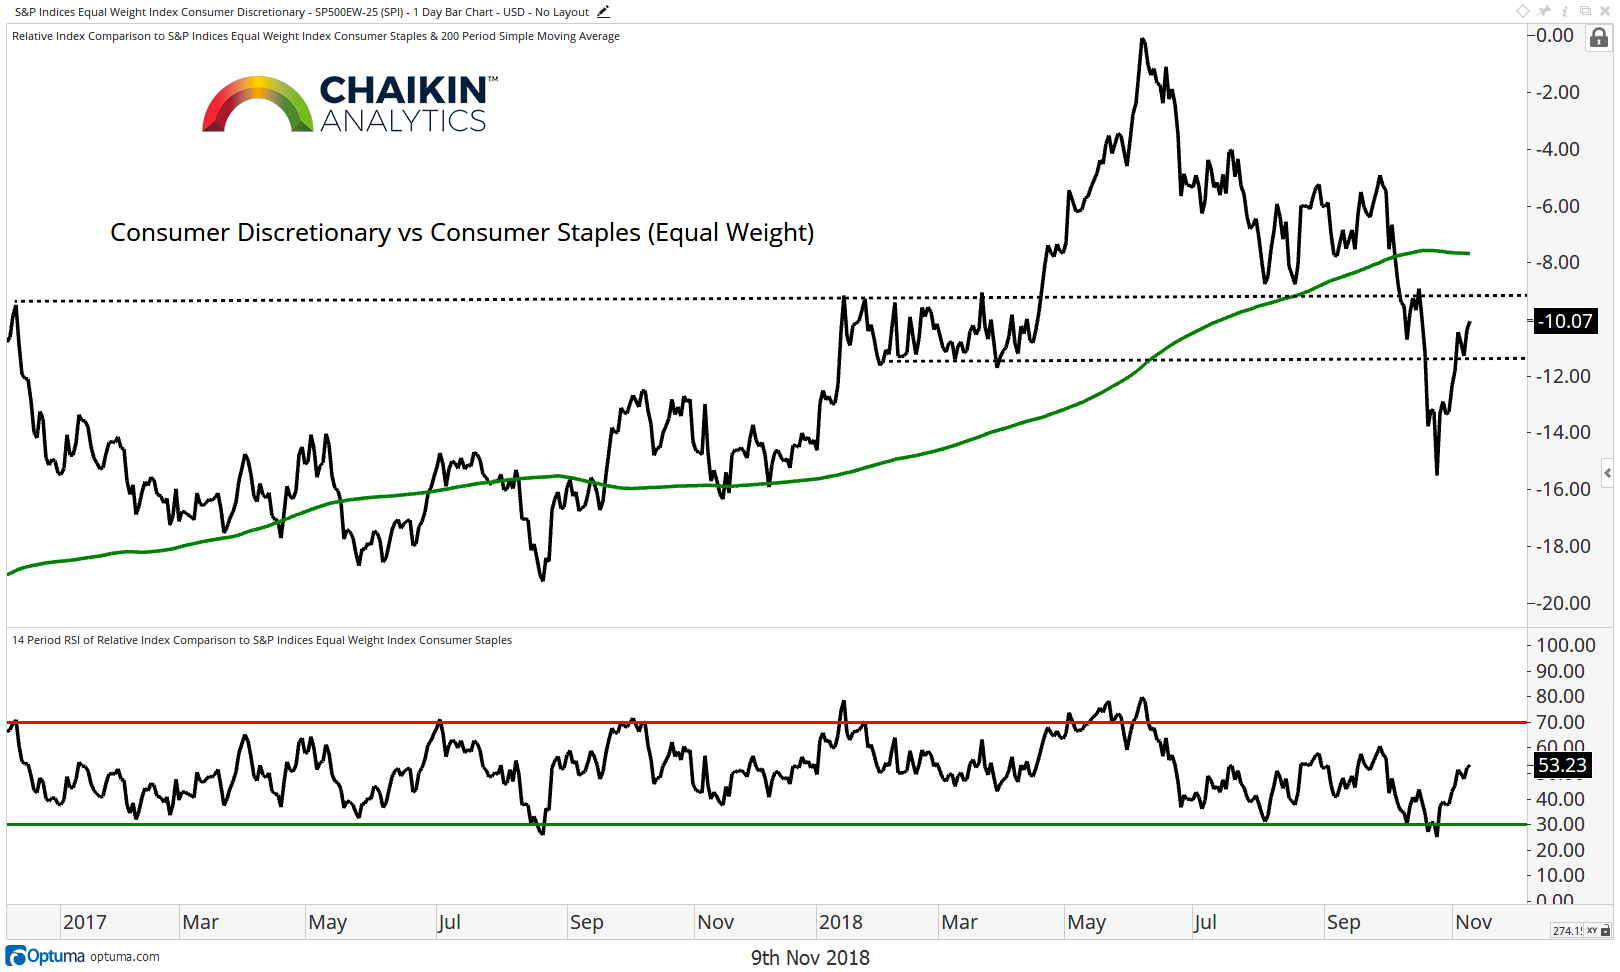
The Consumer Discretionary to Consumer Staples Ratio (Equal Weight)
The ratio of Consumer Discretionary stocks to Consumer Staples stocks remains below the, now declining, 200-day moving average but has rallied from a recent low into a resistance zone. Earnings reports from the traditional (as opposed to internet) retailers have been “better than feared” which is driving the Discretionary names higher. Strength in this ratio is a sign that investors are willing to increase the amount of risk in their portfolios. Bulls want to see the ratio stabilize and begin to move higher while further weakness could have bearish implications.
Current Trend: BEARISH
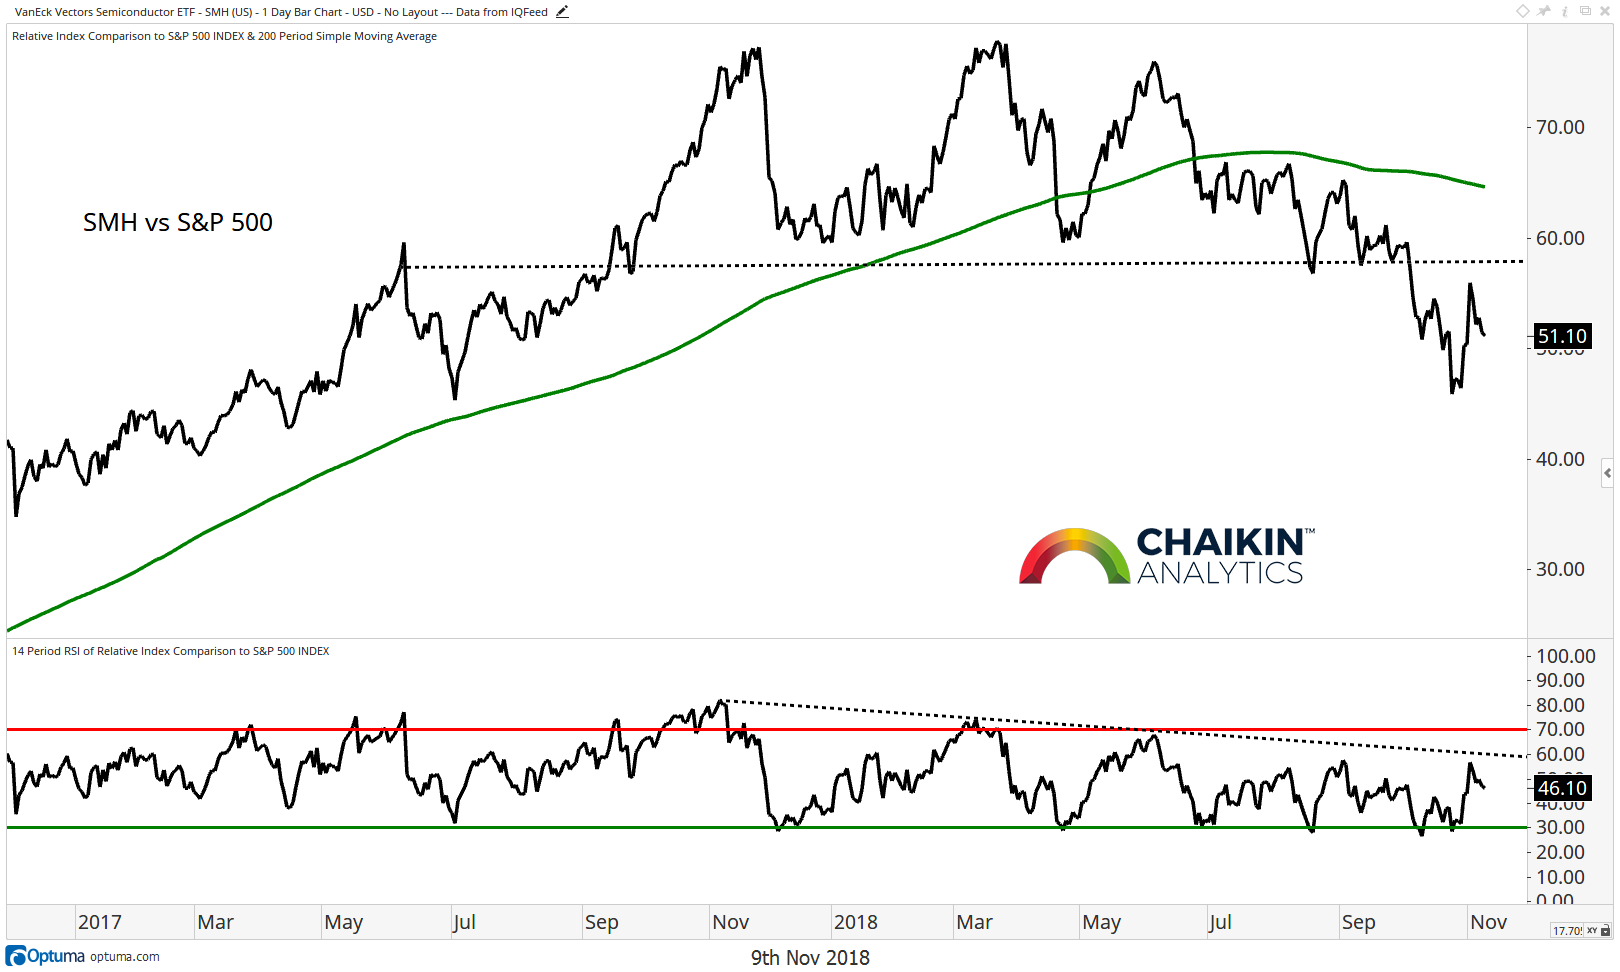
Semiconductors Relative to the S&P 500
After a rally attempt, Semiconductors are once again moving lower relative to the S&P 500. Additionally, the group remains below broken support (now resistance) and the declining 200-day moving average. Finally, the RSI has made a series of lower highs which confirms the weakness in the price trend. Should the semis fail at resistance and move lower again, that would carry bearish implications for the broader equity market.
Current Trend: BEARISH
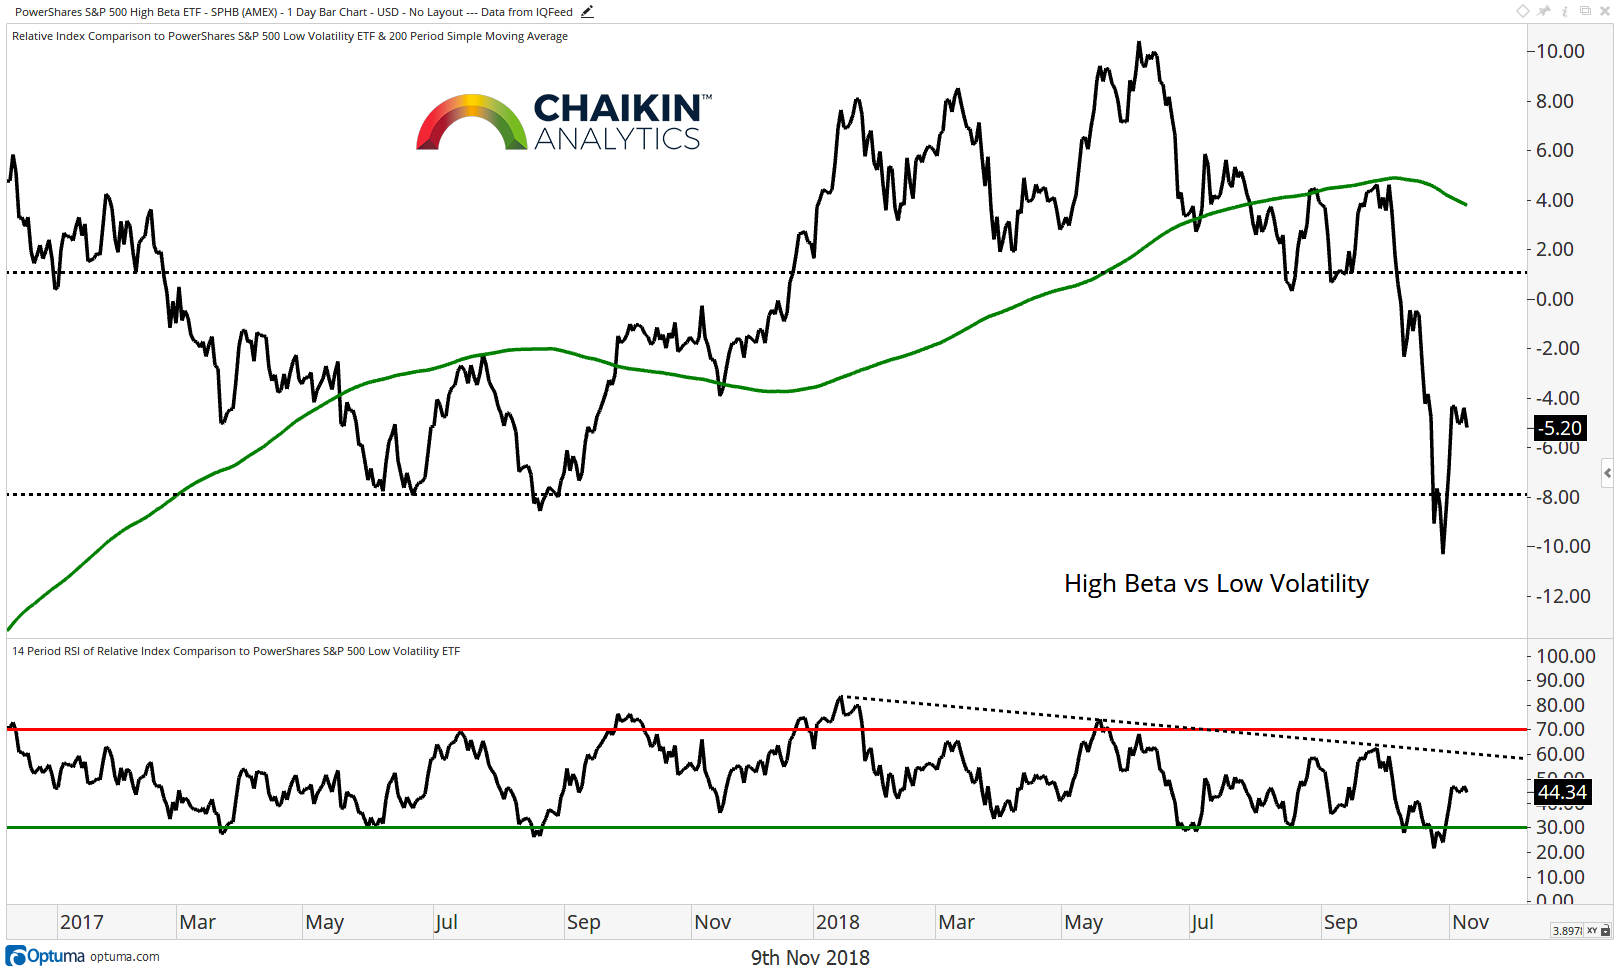
High Beta Relative to Low Volatility
Another way to measure the risk appetite of investors is to look at the performance of the PowerShares S&P 500 High Beta ETF (SPHB) relative to the PowerShares S&P 500 Low Volatility ETF (SPLV). The powerful move from broken support is beginning to stall even as the market has continued to move higher. The group remains below the declining 200-day moving average and price-based resistance. A reversal to the downside would be bearish for equities.
Current Trend: BEARISH
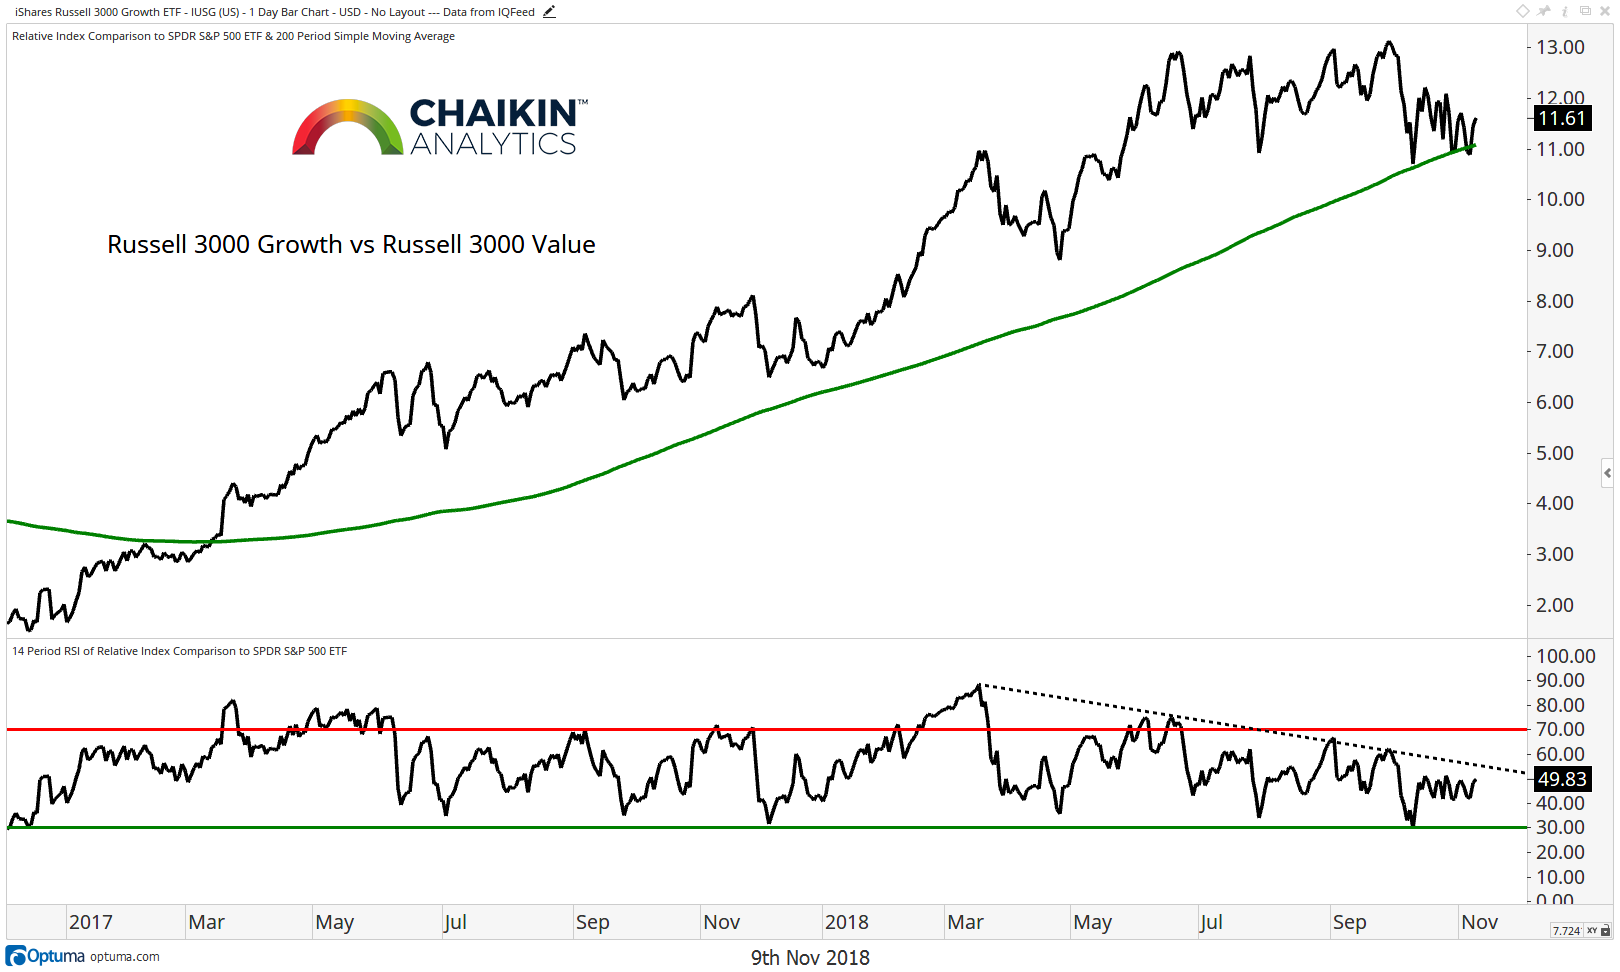
Growth Relative to Value
Russell 3000 Growth remains above the 200-day moving average relative to Russell 3000 Value. However, the RSI continues to make lower highs and is beginning to shift to bearish ranges. This ratio has a positive correlation with the direction of the overall equity market. A break above the recent consolidation would be a positive development for the bulls while a break down would be a negative for equities.
Current Trend: BULLISH
Take-Away: Many of the key themes and relationships which we use to track risk appetite in the market have stabilized and/or rallied in the short term. The major concern remains the breakdown in the Semiconductors relative to the S&P 500.
Twitter: @DanRusso_CMT
Author may have a position in mentioned securities at the time of publication. Any opinions expressed herein are solely those of the author, and do not in any way represent the views or opinions of any other person or entity.


