British Pound ETF update: Expect bounce or consolidation
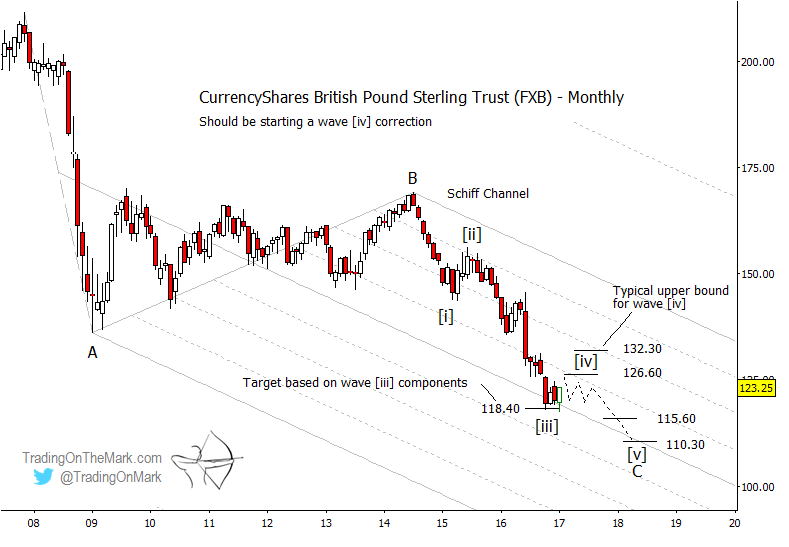
The British Pound appears to be following the script we described in our July post and refined in our October post. On monthly charts for the CurrencyShares British Pound Sterling Trust (NYSEARCA:FXB), we are expecting an elliott wave five-wave sequence down from the 2014 high.
In recent months, key support has held in the area where we suggested the declining third wave of the sequence should stop.
The next phase of the Elliott wave pattern should take the form of a bounce or an upward/sideways consolidation, and other technical tools show how far upward that pattern might reach.
British Pound Elliott Wave 2017 – FXB Monthly Chart
If you’re an active trader, this type of charting can be your guide to finding good entries and exits. New subscribers get a full month of access to all the services we offer, including our Daily Analysis and our Intraday Analysis for just the cost of the Daily Analysis alone.
In the big picture, the British Pound ETF (FXB) has recognized the Schiff channel drawn on the monthly chart above. An upward move to test near the eighth harmonic line is likely, and even a test of the quarter harmonic line is possible. Meanwhile, typical Fibonacci retracement ratios of the wave [iii] distance suggest price should find resistance near the 23.6% measurement at 126.60 and near the 38.2% measurement at 132.30.
It is probably best to have conservative expectations for a corrective bounce. If the elliott wave correction takes the form of a triangle, then the lower resistance area shown on the chart might put a cap on the highest part of the bounce.
On the other hand, if the correction takes a simpler three-wave (a)-(b)-(c) form, then the first resistance area might mark the end of sub-wave (a), and the higher level might cap sub-wave (c).
The duration and the shape of wave [iv] in FXB will depend in part on how quickly the U.S. Dollar advances during 2017. If the Dollar begins rallying again around the middle of the year, as we expect, that would renew the downward pressure on FXB.
Near the end of 2017 or early in 2018 we might begin looking for reach for some Gann square-of-nine targets that sit at 115.60 and 110.30. Those areas might also coincide with a retest of the center line of the channel.
Thanks for reading.
Twitter: @TradingOnMark
No position in any of the mentioned securities at the time of publication. Any opinions expressed herein are solely those of the author, and do not in any way represent the views or opinions of any other person or entity.


: Showing Some Signs of Emerging Strength")
