Two weeks ago, just prior to the Brexit vote, we offered two scenarios for the British Pound, using the CurrencyShares British Pound Sterling Trust (NYSEARCA:FXB).
At the time, we suggested that a vote to remain in the EU could produce a modest bounce in the value of the British Pound, followed by continuation of the larger decline. On the other hand, a vote to leave would produce an acceleration downward into support.
Currently, the share price of the British Pound Currency ETF (FXB) is on the verge of testing the lower support area we had mentioned in conjunction with the “vote to leave” scenario.
It is tempting to view the new lows in the British Pound as an opportunity for a breakout trade downward, but we caution against that. If you are working on a relatively slow time frame, we think there should be better opportunities to take short positions later on, from higher levels. Traders working on faster time frames may even want to fish for countertrend long entries here.
Our reasoning is that British Pound currency (CURRENCY:GBP) and British Pound Currency ETF are approaching a standard Elliott wave and Fibonacci target area where a downward wave [iii] might end, and an upward or sideways wave [iv] might begin.
British Pound Currency ETF (FXB) Chart
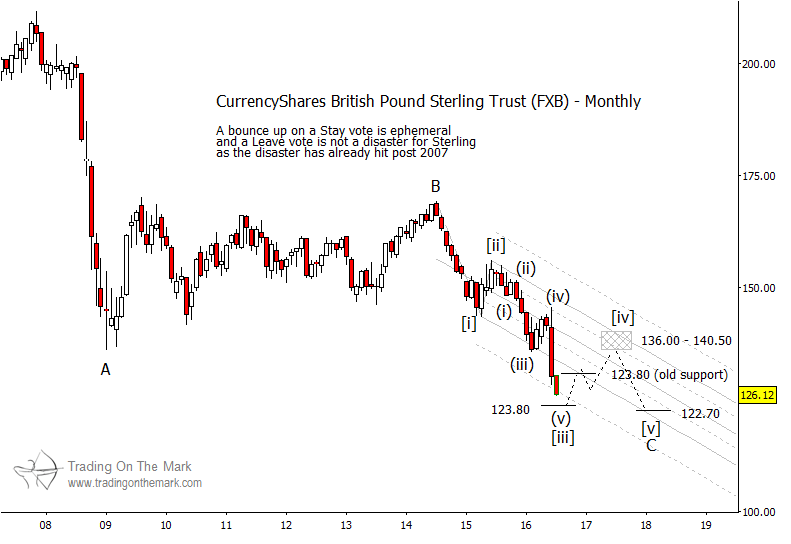
Stepping back to view the British Pound’s status since its high in late 2007, the larger wave structure has consisted of a rapid, impulsive move downward in 2007-2008, followed by a lengthy corrective move sideways that lasted until 2014. We are provisionally treating the entire pattern as a three-wave A-B-C move, with price now heading downward in a five-wave sequence that is wave ‘C’.
As we mentioned in our earlier post, the large A-B-C structure eventually should take the Pound to lower lows beneath the present area, but it may take a year or longer to get there. In the meantime, there should be an opportunity for an upward or sideways correction that could last several months – perhaps even a year.
The modified Schiff channel we have drawn on the chart suggests how the timing might work. With the British Pound ETF (FXB) currently testing near the 50% harmonic beneath the main channel, we would expect the harmonic and/or nearby Fibonacci support around 123.80 to offer a platform for the fund to move up out of its oversold condition. Going forward, traders should watch a combination of channel resistance and typical Fibonacci retracement values to contain a wave [iv] bounce and to offer an opportunity later to catch wave [v] downward. If the correction is more upward than sideways, then the area near 136.00 to 140.50 presents an attractive ceiling for wave [iv].
Our July email bulletin will focus on European stock indices in the wake of the Brexit vote. You can request your copy here. Thanks for reading.
Twitter: @TradingOnMark
No position in any of the mentioned securities at the time of publication. Any opinions expressed herein are solely those of the author, and do not in any way represent the views or opinions of any other person or entity.

: Showing Some Signs of Emerging Strength")
