A negative breadth divergence exists when a broad index is moving higher while a key breadth indicator is actually sloping lower.
In recent weeks, we’ve seen individual stocks like CSX Corp (CSX) break below their 50-day moving average while broad stock market index the S&P 500 has moved higher.
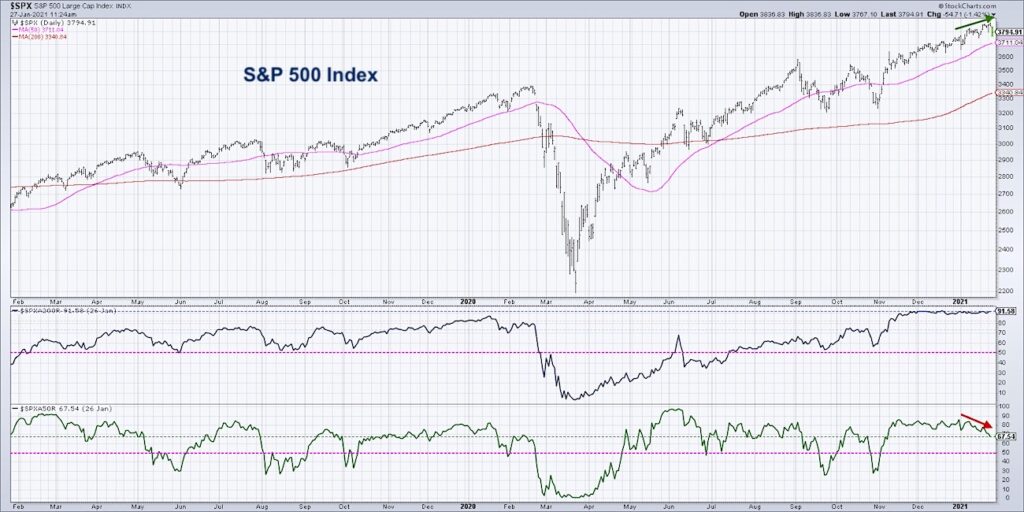
In today’s video, we’ll look at the percent of stocks above their 50-day moving average and why it’s signaling a potential stock market top going into February. We’ll discuss this observation in light of the following 3 market breadth insights. See video and chart further below.
1. How breadth divergences evolve and what they tell us about market participation
2. Why this breadth divergence indicates internal weakness and a higher probability of a market correction
3. How the current breadth readings compare to the market top in February 2020
Breadth Divergence Warning Video
For deeper dives into market awareness, investor psychology and routines, check out my YouTube channel!
S&P 500 Index w/ Market Breadth Indicator Chart
Twitter: @DKellerCMT
The author may have a position in mentioned securities at the time of publication. Any opinions expressed herein are solely those of the author, and do not in any way represent the views or opinions of any other person or entity.

: Showing Some Signs of Emerging Strength")
