Key large and mid cap Brazilian stocks have seen a steep decline in recent weeks, but we caution against becoming too immediately bearish in that market.
There may be a near-term trade for a bounce before the next shorting opportunity comes along for Brazil stocks.
The iShares MSCI Brazil Index ETF (NYSEArca: EWZ) tracks 53 companies that together represent about 85% of the entire Brazilian equity market. In form, the journey from the 2008 index high to its 2016 low counts as impulsive-corrective-impulsive, making it a candidate for a large-scale corrective pattern that is probably complete.
The climb up from the 2016 low also appears impulsive, which allows for the possibility that it represents the start of a much larger rally. The recent decline would then represent the first part of the first corrective move in that larger rally.
This puts us currently in the “middle” of a pattern, which suggests that available trades may be of short duration. So keep your timeframes tight with brazil stocks, especially the Brazil ETF (EWZ).
Last week EWZ tested Gann-related support at 31.37. That might be sufficient to put a floor beneath sub-wave (a) of a correction, but the form would look better with another minor low – possibly a test of the next Gann support at 29.12.
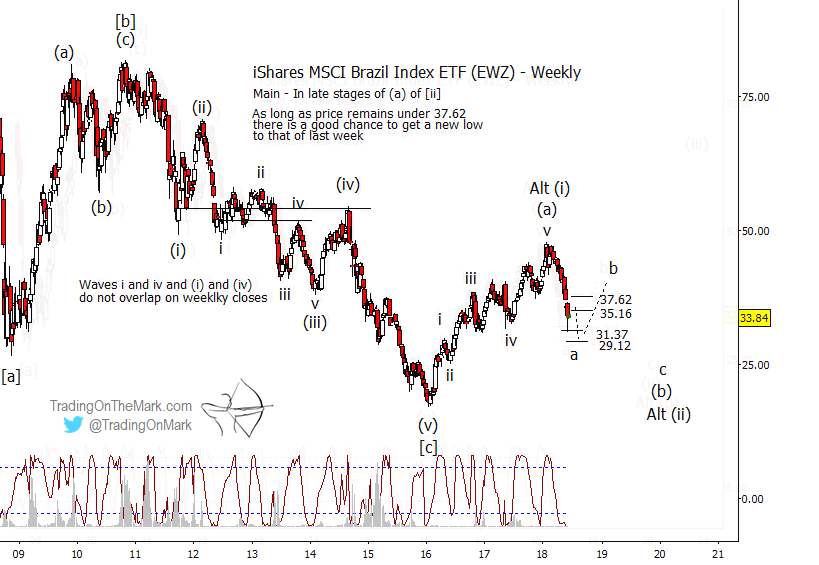
If EWZ finds interim support for a bounce, then bearish traders should begin watching typical resistance levels where sub-wave (b) might end and the next declining sub-wave (c) could begin. Current Fibonacci resistance based on last week’s low is at 35.16 and 37.62, but those levels would change if price makes another near-term low. As long as EWZ remains beneath 35.16 and/or 37.62, it would be risky to say the bounce has commenced.
Trading on this time scale requires patience, but the payoff can be impressive after lengthy moves. This is the pace that might suit a part-time trader or a full-time trader who is taking a lighter approach during the summer months. Right now we’re making a special subscription plan available with those types of traders in mind.
Take out a year-long subscription to TOTM’s Daily Analysisservice (charts every trading day for a wide range of markets), and we’ll deduct the cost of three months of service. Basically you get a whole summer of charts for free! The coupon code to take advantage of this offer is “summer”.
TOTM’s Daily Analysis includes charts every trading day for the S&P 500, crude oil, the Euro and Dollar Index, treasury bonds, and gold.
Twitter: @TradingOnMark
The authors may have a position in the mentioned securities at the time of publication. Any opinions expressed herein are solely those of the author, and do not in any way represent the views or opinions of any other person or entity.

: Showing Some Signs of Emerging Strength")
