Earlier this week we showed how our bearish Elliott wave forecast was working for the Italian stocks ETF. Here we offer a corresponding update to our work on the iShares MSCI Brazil Capped ETF (NYSEARCA: EWZ).
Readers here may remember that in January we reviewed the successful forecast that had foretold of a strong bounce in the Brazil ETF (EWZ).
We updated that forecast in April to note the main resistance areas to watch for the next sizable decline.
With resistance for the ‘b’ wave being tested, price looks almost ready to embark on a strong downward ‘c’ wave.
Such a move would represent the counterpart to wave ‘a’ that moved the fund down so quickly during the first half of 2018.
Here’s our latest Elliott wave chart with analysis of the $EWZ.
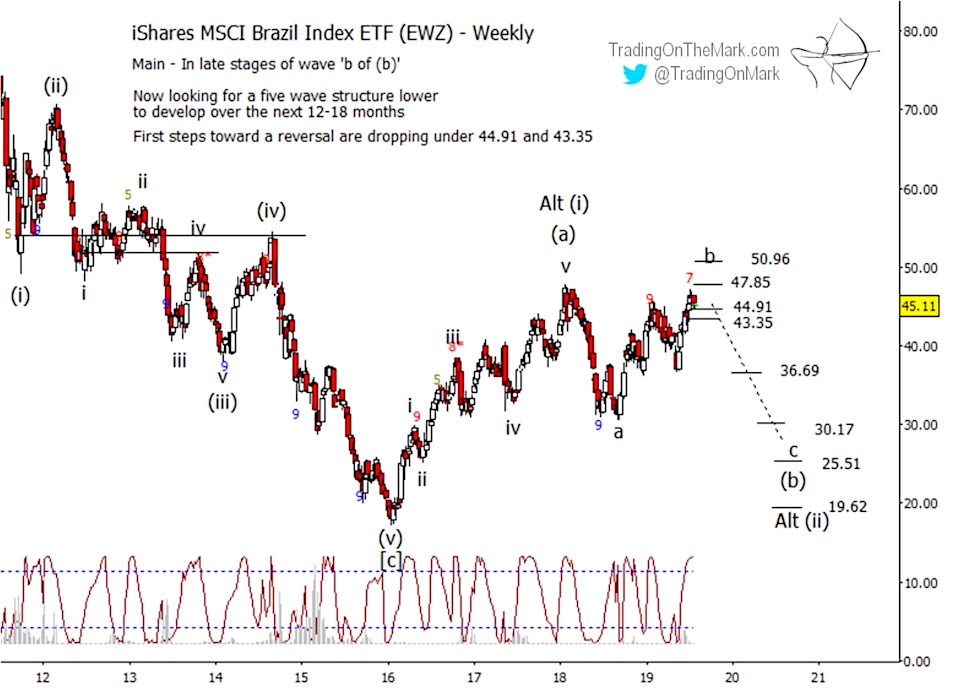
Price has already tested and overcome resistance at 43.35 and 44.91, but those levels are still relevant for traders who want confirmation of the downward breakout. Meanwhile the resistance at 47.85 looks very attractive, and 50.96 could serve as a backup area to watch for the end of wave ‘b’ of (b).
Note also how the Lomb periodogram is solidly in the reversal zone. A price reversal from near 47.85 would imply preliminary support targets near 36.69 and 30.17. Declining wave ‘c’ of (b) might even reach 25.51 or 19.62.
Get a competitive edge in the market by subscribing to our free newsletter and following us on Twitter. For more frequent traders our premium services cover the S&P 500, crude oil, gold, the Euro, the Dollar and treasuries.
Twitter: @TradingOnMark
The authors may have a position in the mentioned securities at the time of publication. Any opinions expressed herein are solely those of the author, and do not in any way represent the views or opinions of any other person or entity.

: Showing Some Signs of Emerging Strength")
