As the Russell 2000 (IWM) broke below it’s 50-Day Simple Moving Average (SMA) last week, we noted the same day that the 12 previous occurrences of this event (i.e since the beginning of 2013) had evolved into a consistent bear trap cycle, inciting rapid and ravenous buying on what conventional technical wisdom suggests is a bearish development.
Summarizing the statistics there we observed:
On average: IWM spends 2 days below it’s 50-Day SMA, losing -1.73% over that period.
One week later, we can make it 13-of-13: in close alignment with the averages established over the last year, IWM spent 3 days (including the initial close) below the 50-Day SMA, falling -1.55% beneath the average before bouncing (below: orange rectangle, far right) last Thursday.
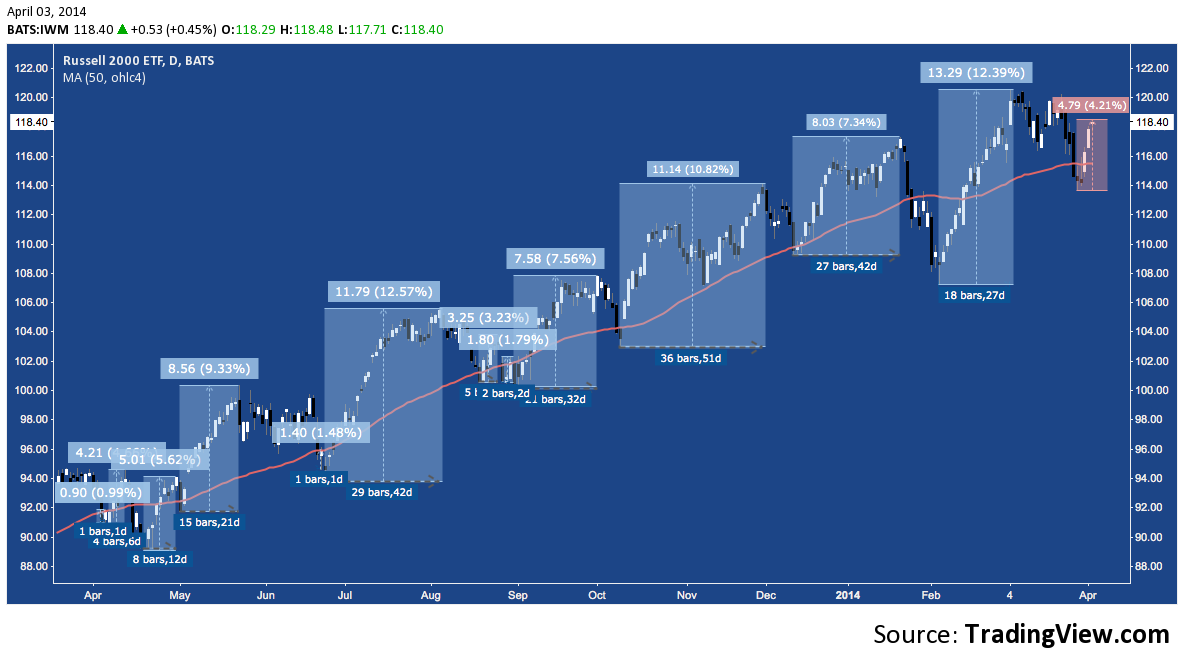
From the bottom put in place during the previous 12 round-trips across the 50-Day SMA, here’s the breakdown of subsequent positive performance mentioned there:
How long is IWM’s advance after bottoming below its 50-Day SMA?
- Shortest time to next peak (including bottom): 2 days (April, June 2013)
- Longest time to next peak (including bottom): 37 days (October-November 2013)
- Average time to next peak (including bottom): 15 days
How does IWM performance during these advances after bottoming below its 50-Day SMA?
- Best performance: +12.39% (February-March 2014)
- Worst performance: +0.99% (April 2013)
- Average performance: +6.48%
- Average daily performance given average time to next peak: +0.43%
Over these occurrences the average bounce from the trough below the 50-Day SMA is +6.48% over 15 trading days.
Looking at the present, IWM is well ahead of the average pace, already covering as much as +4.21% in 5 trading days. The chart below shows the weak (+0.99% in 2 sessions), average and strong (+12.39% in 37 sessions) bounce scenarios, with the current bounce-in-progress in orange. The average bounce scenario sees an additional +2.27% of upside for IWM over the next 2 weeks.
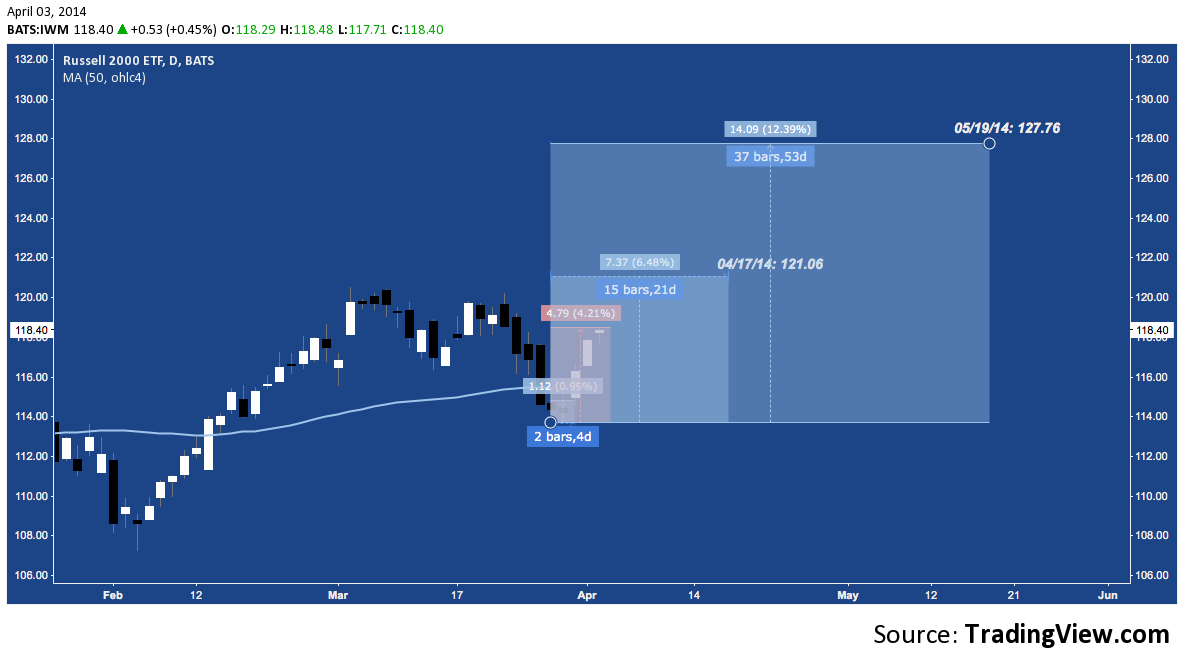
This February’s bounce was the strongest over the series studied, advancing 12.4%. A comparable move here would carry IWM far above it’s all-time high just over 120. If that happens, expect all-pervasive talk about a “repeat of 2013” – and the rumored extinction of the bears trapped with increasingly boring consistency (and complacency) over the last 12 months.
Twitter: @andrewunknown and @seeitmarket
Author carries net short Russell 2000 exposure at time of publication. Commentary provided is for educational purposes only and in no way constitutes trading or investment advice.
Charts courtesy tradingview.com.
Any opinions expressed herein are solely those of the author, and do not in any way represent the views or opinions of any other person or entity.
: Creating Bullish Divergence?")

 and Semiconductors (SMH): Concerning Price Pattern?")
 and Semiconductors (SMH): Concerning Price Pattern?")


