“What we’re seeing is an increase in the evolutionary pace of IED (improvised explosive device) design. It’s increasing at a pace we previously haven’t seen.” – Ben Venzke
The traditional benchmark asset allocation is 60/40 – 60% in stocks, 40% in bonds. Such a “balanced” allocation is considered to be a moderately conservative investment posture as drawdowns in equity prices have typically been partially offset by gains on fixed income holdings.
Since the financial crisis of 2008, the appetite for higher returns sparked by historically low yields on many fixed income assets may have changed that asset allocation calculus. What may appear to be nuance to some could cause a gross underestimation of risk if equity prices fall.
High Yield IEDs
To explain, consider a simple proxy 60/40 portfolio. We assign the S&P 500 Index (INDEXSP:.INX) to represent the 60% equity component. Many investors opt for a split between the NASDAQ (INDEXNASDAQ:.IXIC), Dow Jones Industrials, or Russell 2000, but for purposes of this analysis, the S&P 500 will suffice. On the fixed income side there are many types of debt securities in which to invest but for the 40% allocation we allocated 20% to U.S. Treasuries, 10% to investment grade corporates and 10% to high-yield corporate bonds (NYSEARCA:HYG).
The primary drawback of the fixed income allocation in recent years is the low yields delivered by Treasuries (end of June average 1.90%) and investment grade bonds (end of June average 3.20%). Thus, many investors have chosen to boost the income potential of their portfolios by increasing their exposure to high yield bonds (end of June average 6.05%). While done under the guise of safe fixed-income investing, this adjustment introduces a hidden risk which increases the probability of loss.
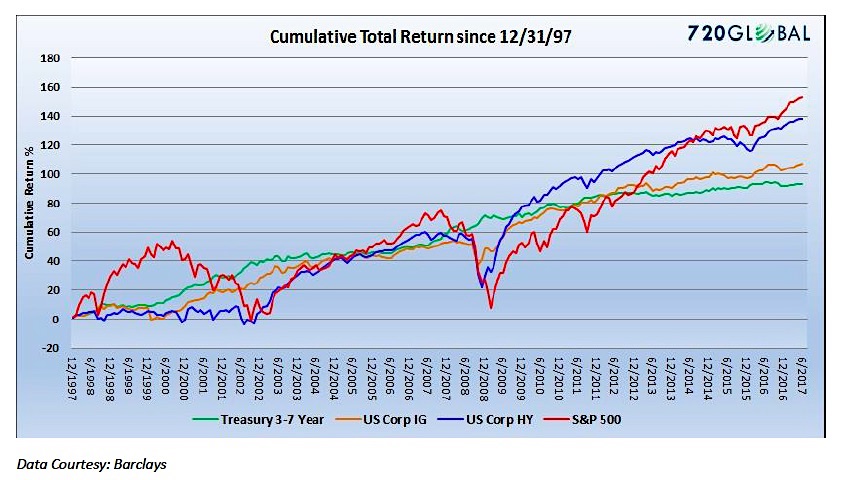
The chart above illustrates the cumulative total return profile of 3-7 year Treasuries, the S&P 500 index, aggregate corporate investment-grade index and the aggregate corporate high-yield index since December 1997. It is evident that the returns of high-yield bonds (blue) closely mimic those of the S&P 500 (red) and bare much less resemblance to the other fixed income measures. So instead of the 60/40 portfolio that many investors think they have, the reality is that the allocation described above is more accurately labeled as 70/30 and higher for those with a more aggressive high-yield allocation.
High yield bonds cloaked as a “safe” holding represents a veiled risk especially given that valuation of high yields bonds, like equities, are at extremes. Using data going back to 2000, Option-adjusted-spreads are in the 17th percentile while yield-to-maturities are in the 2nd percentile. When such extreme valuations on high-yield bonds are combined with an appreciable risk of default and potential recovery values of less than 30%, this allocation more appropriately resembles an equity allocation and should be considered as such.
The high yield bond market has come to resemble an IED in the financial markets for investors with risks that are both disguised and highly destructive. Awareness of these risks is the first step toward defusing them.
This brief article will serve as a springboard for future Unseen articles for premium subscribers that will provide an in depth look at high yield valuations and offering various trade ideas.
Twitter: @michaellebowitz
Any opinions expressed herein are solely those of the author, and do not in any way represent the views or opinions of any other person or entity.


: Showing Some Signs of Emerging Strength")
