Going back and looking at trading chart patterns with a “coulda shoulda woulda” eye can be annoying.
So forgive me for the following Bitcoin (CURRENCY:BTC) charts. I love chart patterns and curiosity got the best of me as I saw Bitcoins parabolic move hit a cluster of potential targets and reverse lower.
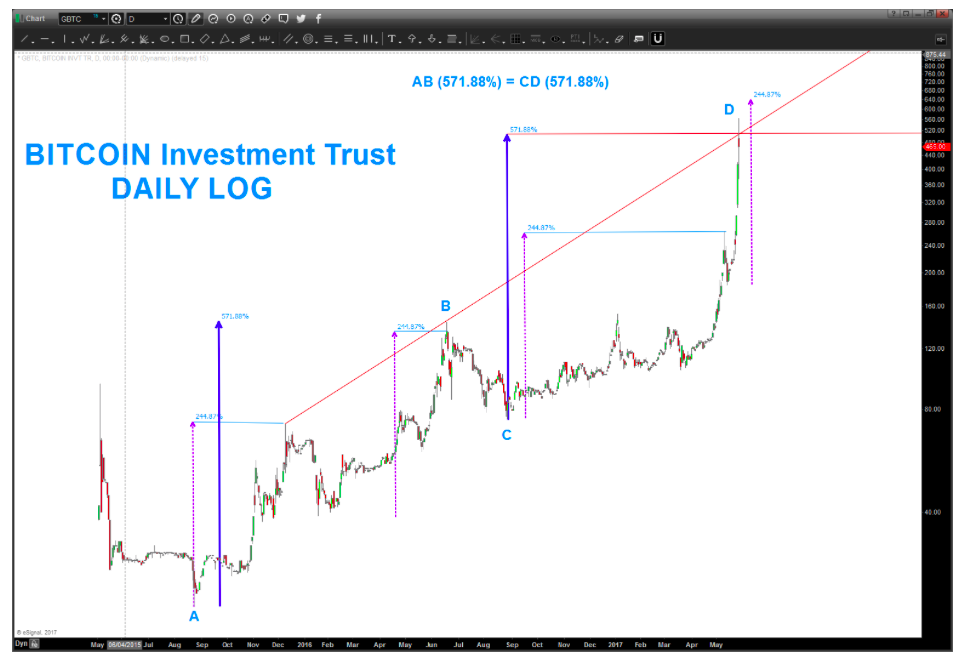
When traders see parabolic moves, they need to think Logarithmic charts (log scale charts). It’s why the darn things were created in the first place!
Okay, let’s throw some geometry on the charts.
As you can see below The Bitcoin Investment Trust (OTCMKTS:GBTC) ran smack into a logarithmic AB=CD pattern as well as a key logarithmic trend line. So resistance was to be expected. But also note that there is another set of higher targets (…possible?).
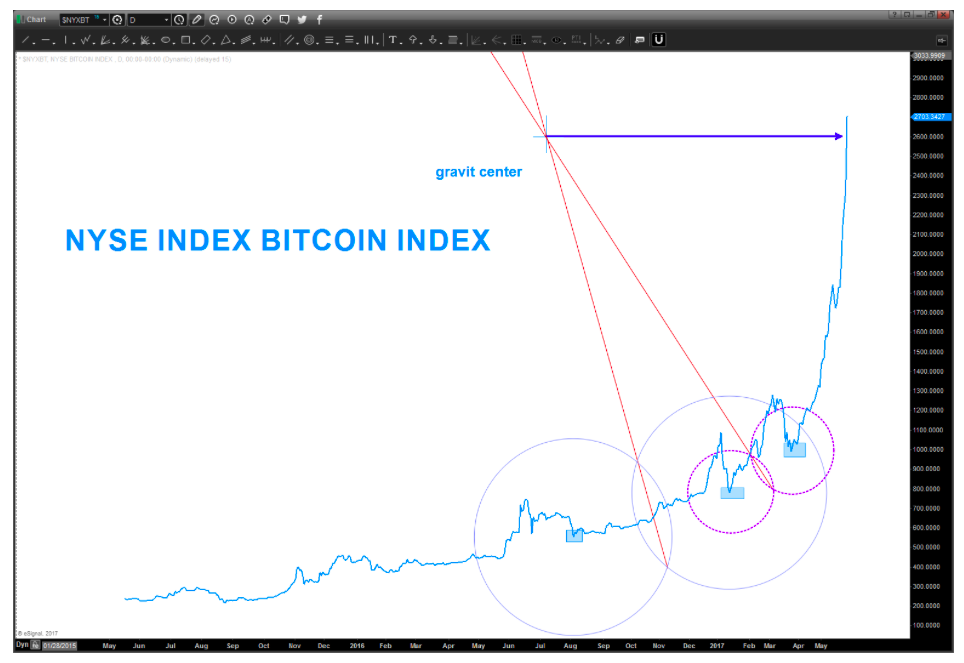
I’ve also included the NYSE Bitcoin Index (INDEXNYSEGIS:NYXBT). You can see that it ran smack into the GRAVITY CENTER. I used the same technique that I was taught in elementary school on how to make a circle using three points (seriously).
When parabolic moves end they don’t go out with a whimper, they drop like a lead weight.
Thanks for reading.
ALSO READ: NASDAQ: Why 6200 Could Bring A Market Top
Twitter: @BartsCharts
Author does not have a position in mentioned securities at the time of publication. Any opinions expressed herein are solely those of the author, and do not in any way represent the views or opinions of any other person or entity.


