The Crypto market is in decline as we have been warning for some time.
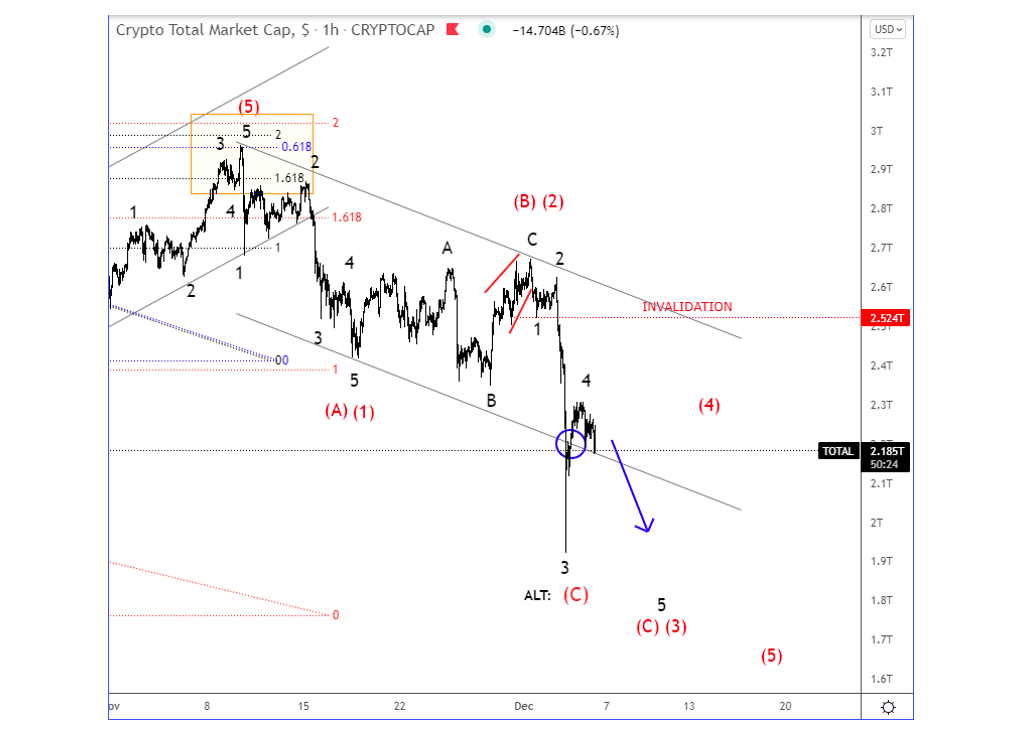
And, with recent sharp decline and broken channel support line on the Crypto-currency total market cap chart, there’s a chance for more weakness within a five-wave cycle (if the price manages to stay below the 2.5T level).
Let’s look at the market cap chart first, then discuss the Elliott wave patterns for Bitcoin and Ripple.
Crypto Total Market Cap 1-hour chart – Elliott Wave Analysis
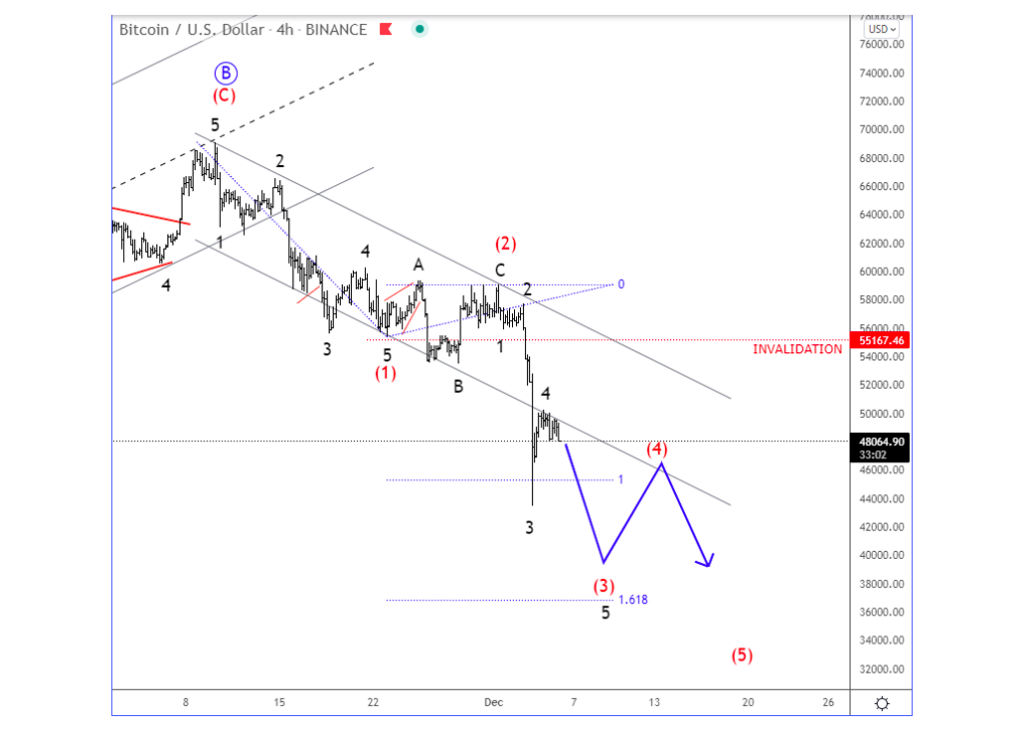
Bitcoin (BTCUSD) is accelerating even lower in the 4-hour chart, which was expected based on a projected daily flat correction. So, seems like there’s now room for more weakness within a five-wave cycle for wave C, which can send the price much lower, ideally towards June Lows and 29k-20k support zone, just be aware of shot-term pullback in wave (4). We remain bearish as long as the price is below 55k invalidation level.
Bitcoin 4-hour chart – Elliott Wave Analysis
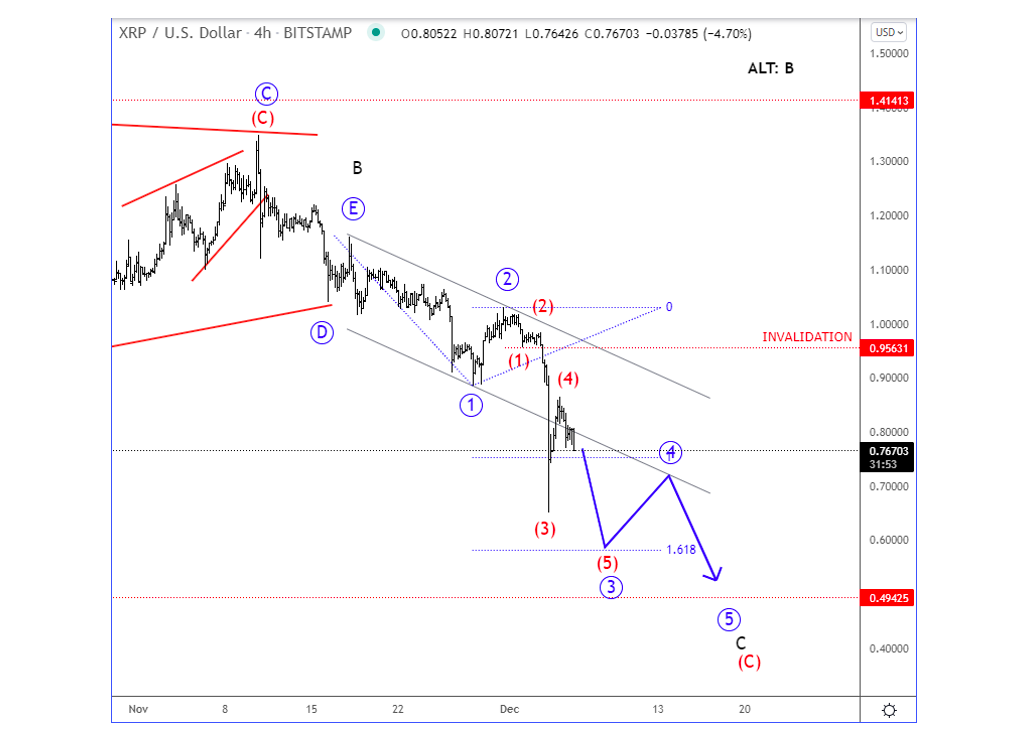
Ripple (XRPUSD) is bearish as expected and seems like a bearish triangle in wave B has been completed earlier, so with current acceleration lower in the 4-hour chart, we are tracking a higher degree wave C that can be finished by a five-wave bearish cycle. So, watch out for more downside pressure in upcoming days, ideally towards June lows and 0.50 – 0.20 support area, just be aware of a pullback in wave 4. We remains bearish as long as it’s below 0.95 invalidation level.
Ripple 4-hour chart – Elliott Wave Analysis
Twitter: @GregaHorvatFX
The author may have a position in the mentioned securities at the time of publication. Any opinions expressed herein are solely those of the author, and do not in any way represent the views or opinions of any other person or entity.

: Worrisome to Broader Market?")

