Over the past several months, we’ve slowly built up some Bitcoin research indicators (and others focused on the cryptocurrency market).
As most of our clients are in the institutional space and hence either can’t invest or don’t have the appetite to invest in bitcoin and cryptocurrencies, I thought I would share some of our Bitcoin research and charts with you.
This article follows on from a previous piece we did charting the rise of Bitcoin. While that article focused more on putting things into perspective, today’s article looks at some timing / tactical indicators that draw on analytical methods from the more traditional and long-established asset classes.
It’s still somewhat difficult to analyze this asset class properly due to the limitations on data (most asset classes like stocks, bonds, commodities have decades if not centuries of data), but with a bit of creativity and resourcefulness (essential traits for any aspiring analyst) we can have some quantitative / objective signals and indicators to inform the view and characterize the risks and opportunities in the market.
For clarity, this is not to be interpreted as advice, and indeed there are considerable limitations in the analysis, however it is a first step in developing a set of indicators which may grow in usefulness over time and provide some order to Bitcoin research.
The key takeaways on the Bitcoin tactical indicators are:
- Heavy shorting of bitcoin investment trusts and futures show there is still a significant element of pessimism in the market.
- Premium vs NAV for bitcoin investment trusts and Google search interest sentiment are moving away from contrarian bearish signals, but are not yet in contrarian bullish territory.
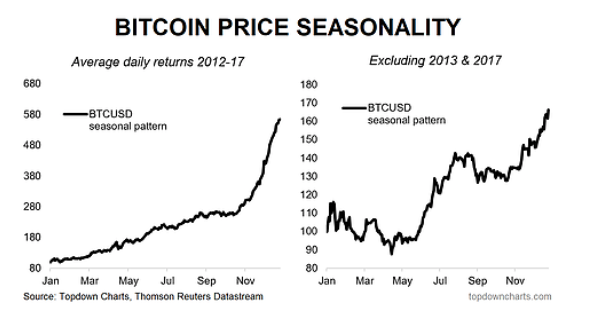
- Seasonality analysis seems to show a tendency for price to trend down in the first half of the year and pickup around May/June.
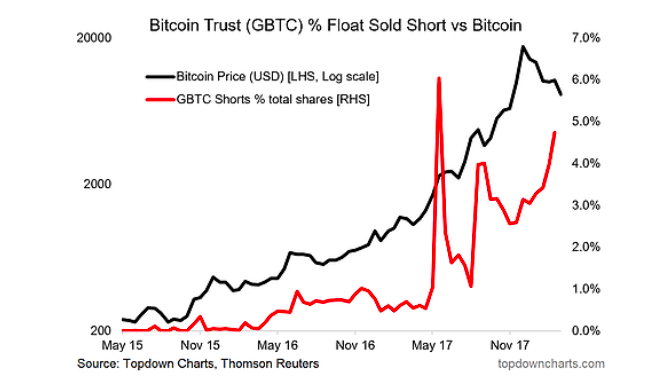
1. Bitcoin Investment Trust Shorts: First up is a look at short interest in Bitcoin investment trust as a percentage of shares outstanding. While the data is only up to the end of February, it’s showing still very heavy shorting in this vehicle – which is an indirect way of holding Bitcoins. Typically in the stockmarket you think of a surge in shorts as a contrarian bullish signal because it both represents potential future buying (to cover shorts) and it represents investor sentiment – which at this point looks to be exhibiting extreme pessimism. However there does appear to be an element of ‘smart money’ behavior in this indicator as previous spikes seemed to line up with short-term market tops.
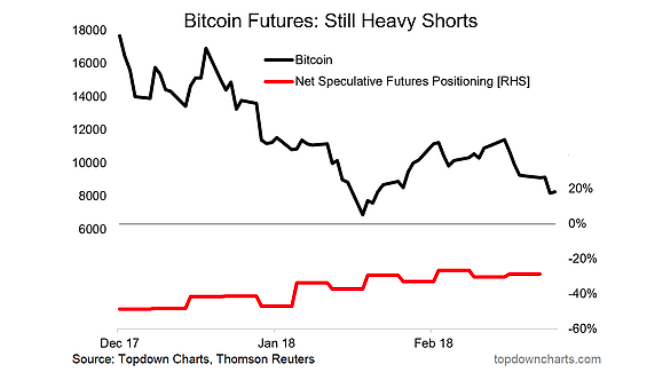
2. Bitcoin Futures: One of the issues with analyzing a relatively new asset like Bitcoin and other cryptocurrencies is the short history of data (most traditional financial market analysis relies on decades of time series data), and with Bitcoin futures only launching late last year it’s a case in point. So far speculative futures positioning has been consistently net-short, although there has been a gradual trend up in this indicator as the price has come down (likely traders locking in gains from their so far justifiably held short positions).
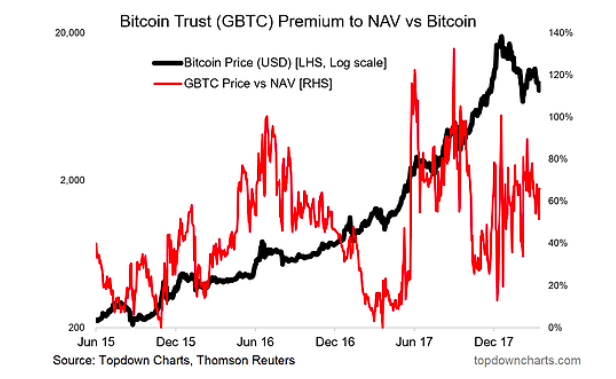
3. Bitcoin Trust NAV Premium/Discount: Back on to the Bitcoin investment trust (and there are other traded funds out there too but this one has more history – also note: no securities advice here, just using this for analytical purposes!), there also appears to be some sentiment information in the degree of premium to NAV (net asset value). The premium will widen if there is more selling pressure in the actual investment trust or if the underlying Bitcoin price falls (or increases at a slower pace than demand for the investment trust). With that said, there does appear to be some contrarian signals here: i.e. particularly wide premiums are often seen around short-term tops (a sign of excess optimism), and particularly narrow premium to NAV is often seen around short term bottoms.
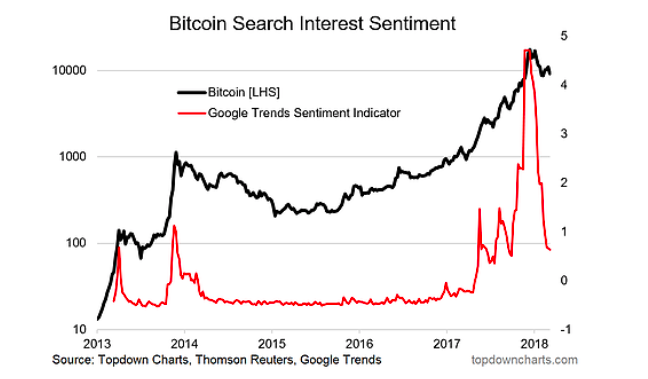
4. Bitcoin Search Interest Sentiment: This one shows a composite of search terms in google trends (e.g. ‘buy bitcoin’, ‘trade bitcoin’, ‘bitcoin mining’). So a couple of observations on this one: in the past, spikes in this indicator seem to line up with buying climaxes (short term tops), and surges in Bitcoin often come after a period of relative disinterest or lack of searching. In that sense this indicator probably needs to come down some more before a longer term bottom is established. As a side note i have just put a Twitter survey which shows relatively low allocations to cryptocurrencies among investors.
5. Bitcoin Price Seasonality: Final one, another traditional financial market analytical tool (and rule of thumb) is around seasonal tendencies e.g. the famous saying in the stockmarket “sell in May”. Again this analysis is limited by the relatively small amount of data available. Furthermore, the 2013 and 2017 periods seem to skew the results, so I have also run the analysis for ex-13 & 17 and it seems there is a tendency for negative seasonality in Q1, with an apparent “buy in May” pattern seeming to emerge. It will be interesting to see if this seasonal tendency shows up again this year.
Thanks for reading.
Twitter: @Callum_Thomas
Any opinions expressed herein are solely those of the author, and do not in any way represent the views or opinions of any other person or entity.


